Copyright
©2010 Baishideng.
World J Gastroenterol. Jan 14, 2010; 16(2): 232-236
Published online Jan 14, 2010. doi: 10.3748/wjg.v16.i2.232
Published online Jan 14, 2010. doi: 10.3748/wjg.v16.i2.232
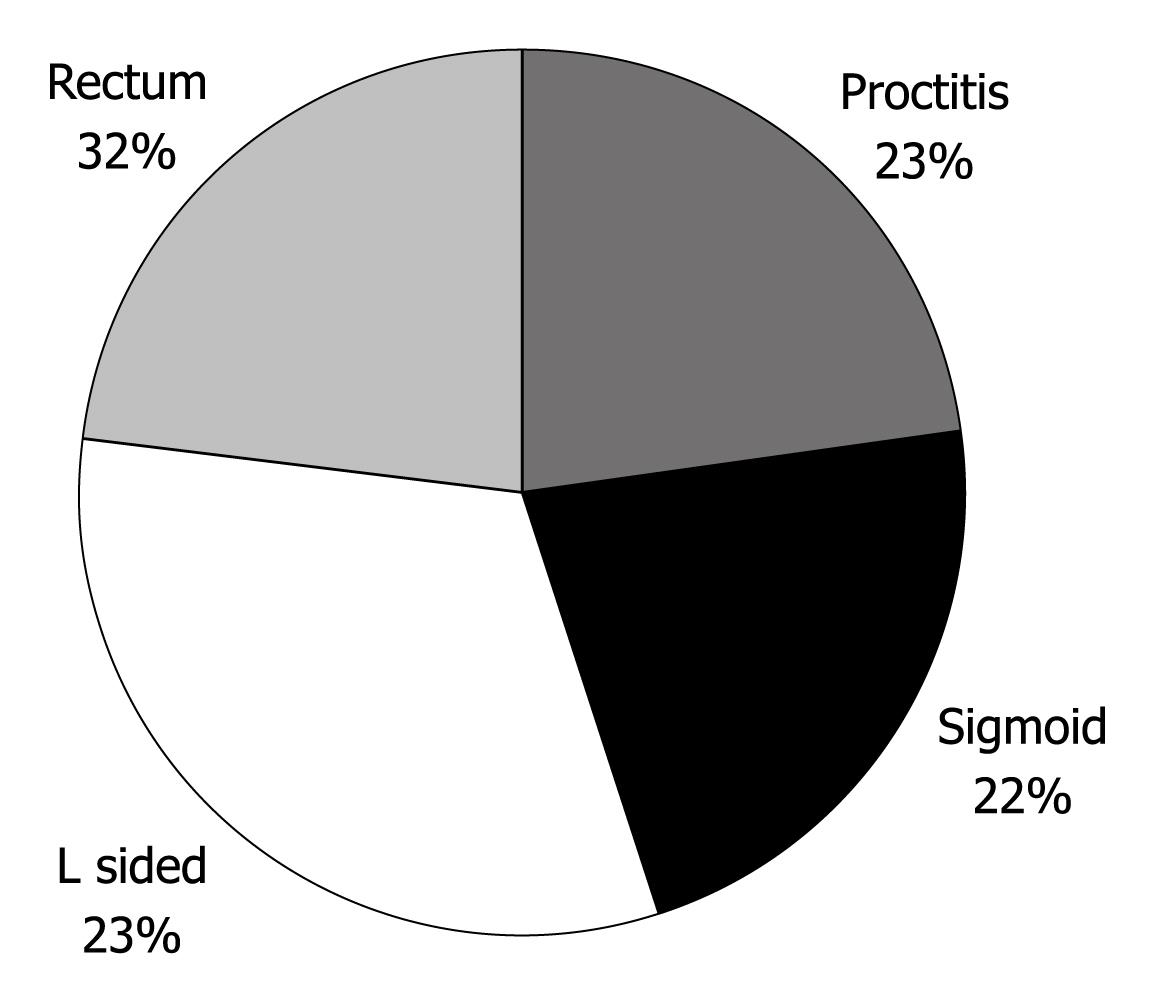
Figure 1 Extent of disease in the ulcerative colitis (UC) patient cohort.
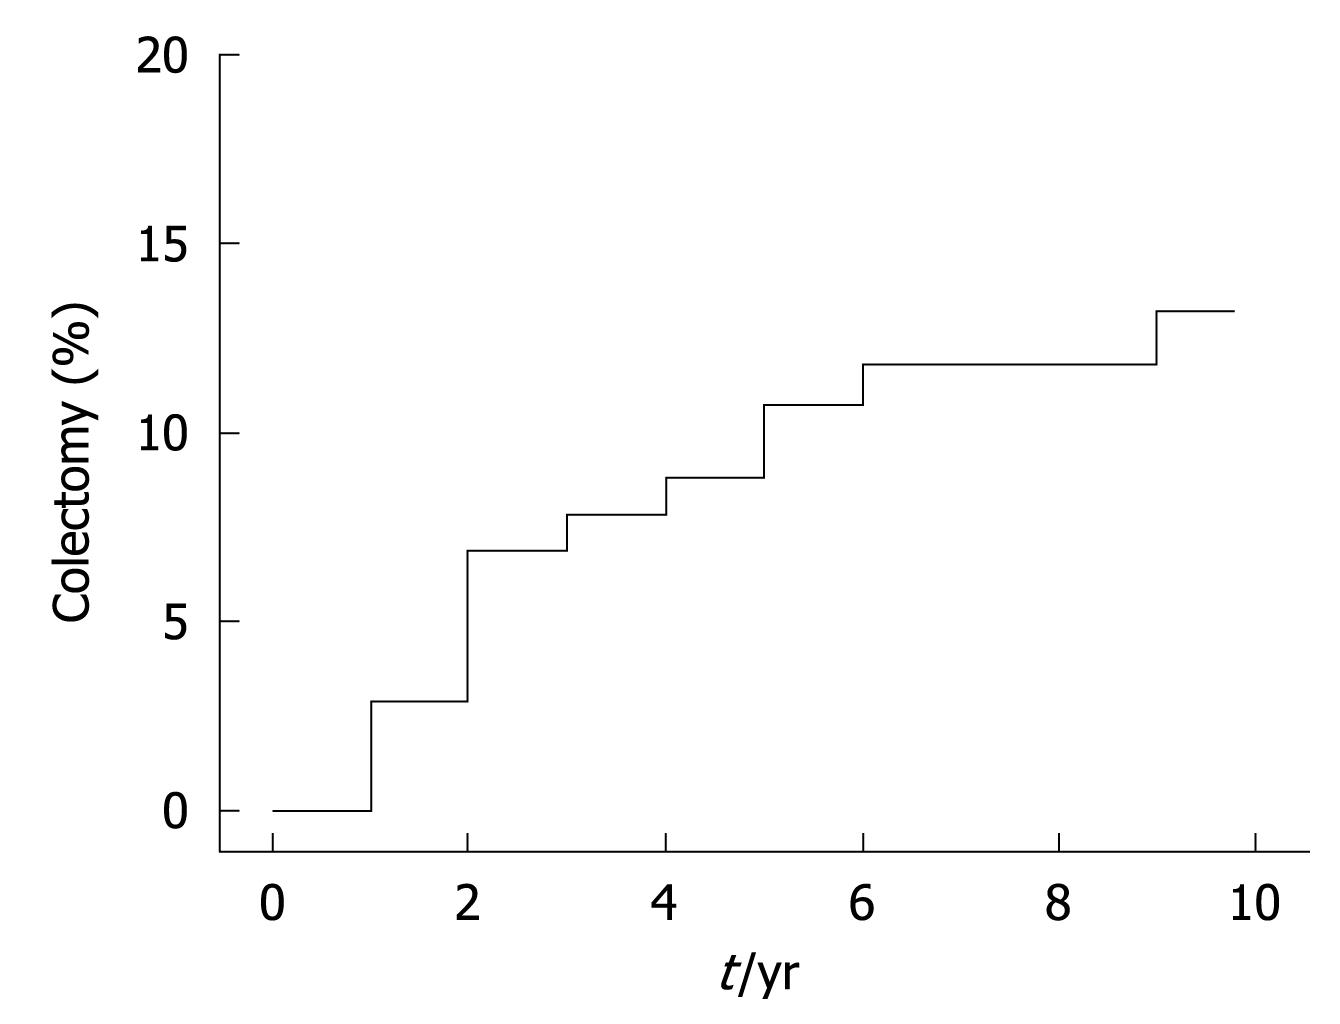
Figure 2 Kaplan Meier curve of colectomy over time.
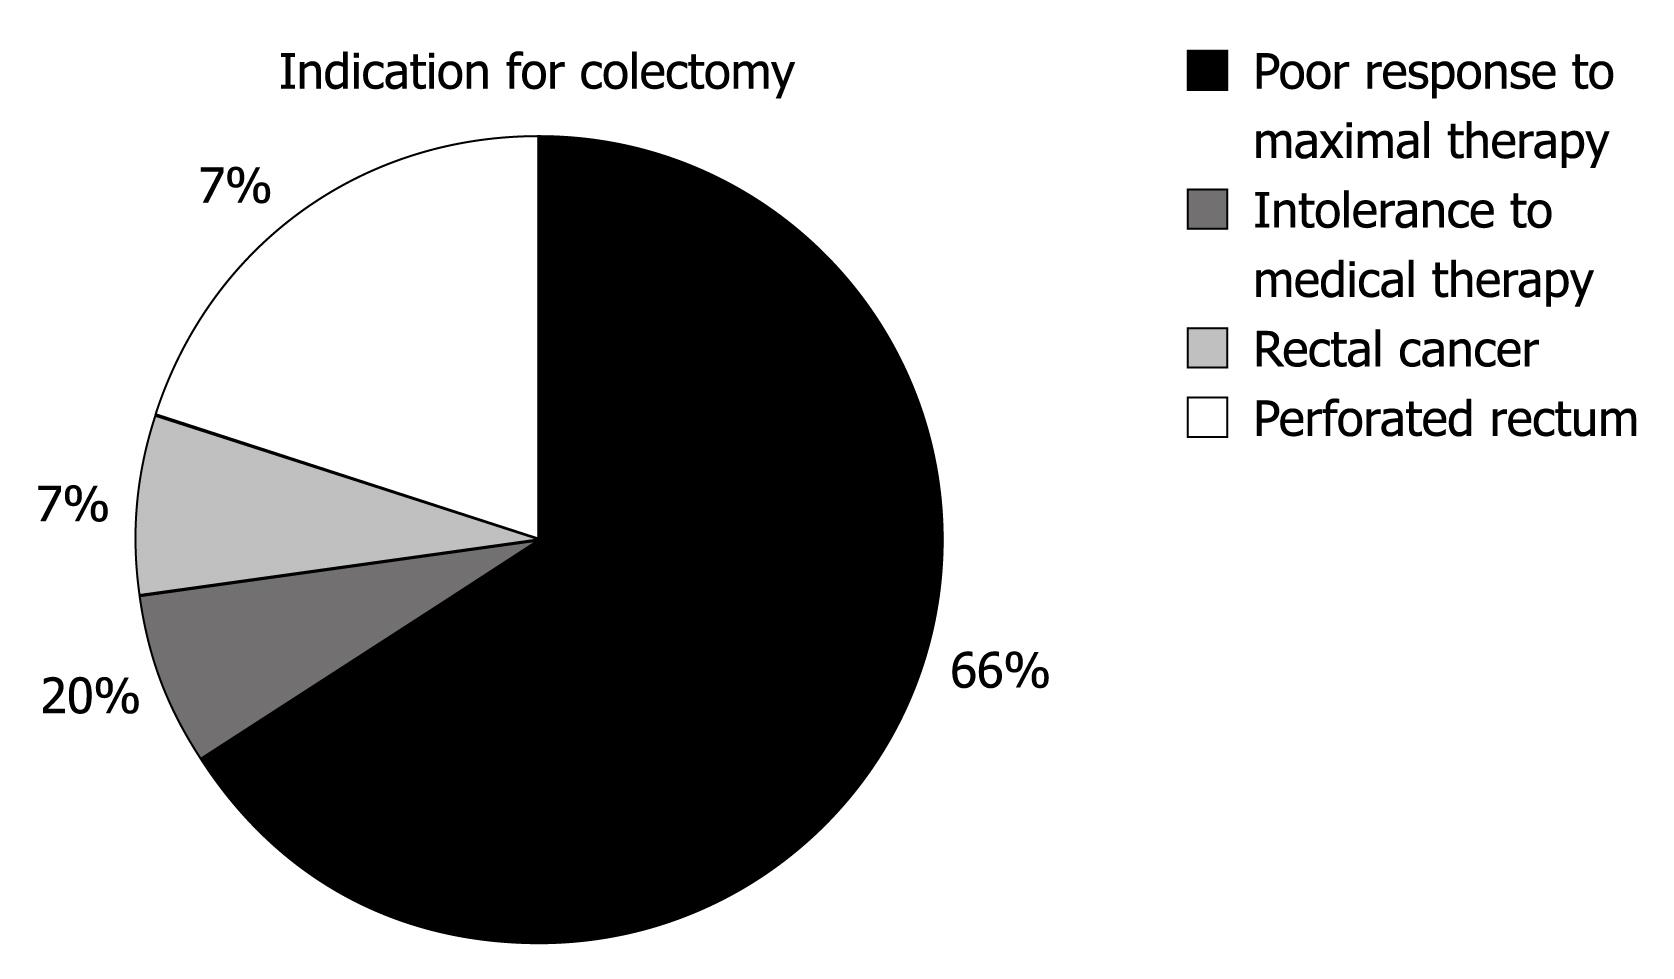
Figure 3 Indications for colectomy in 15 patients in the UC cohort.
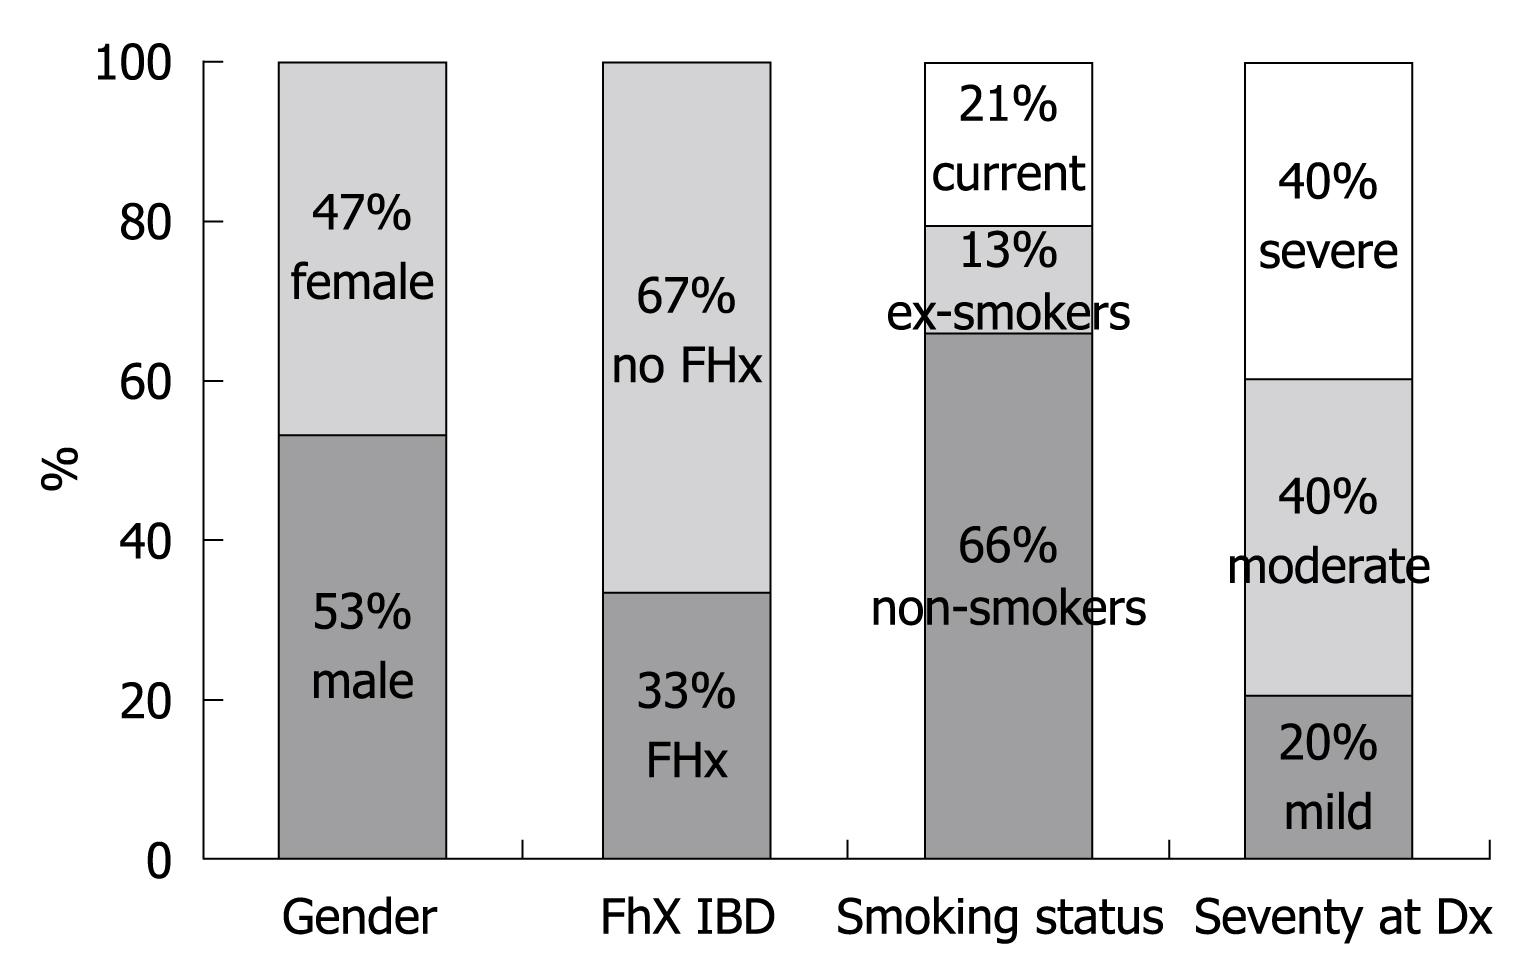
Figure 4 Demographic data on UC patients who underwent colectomy.
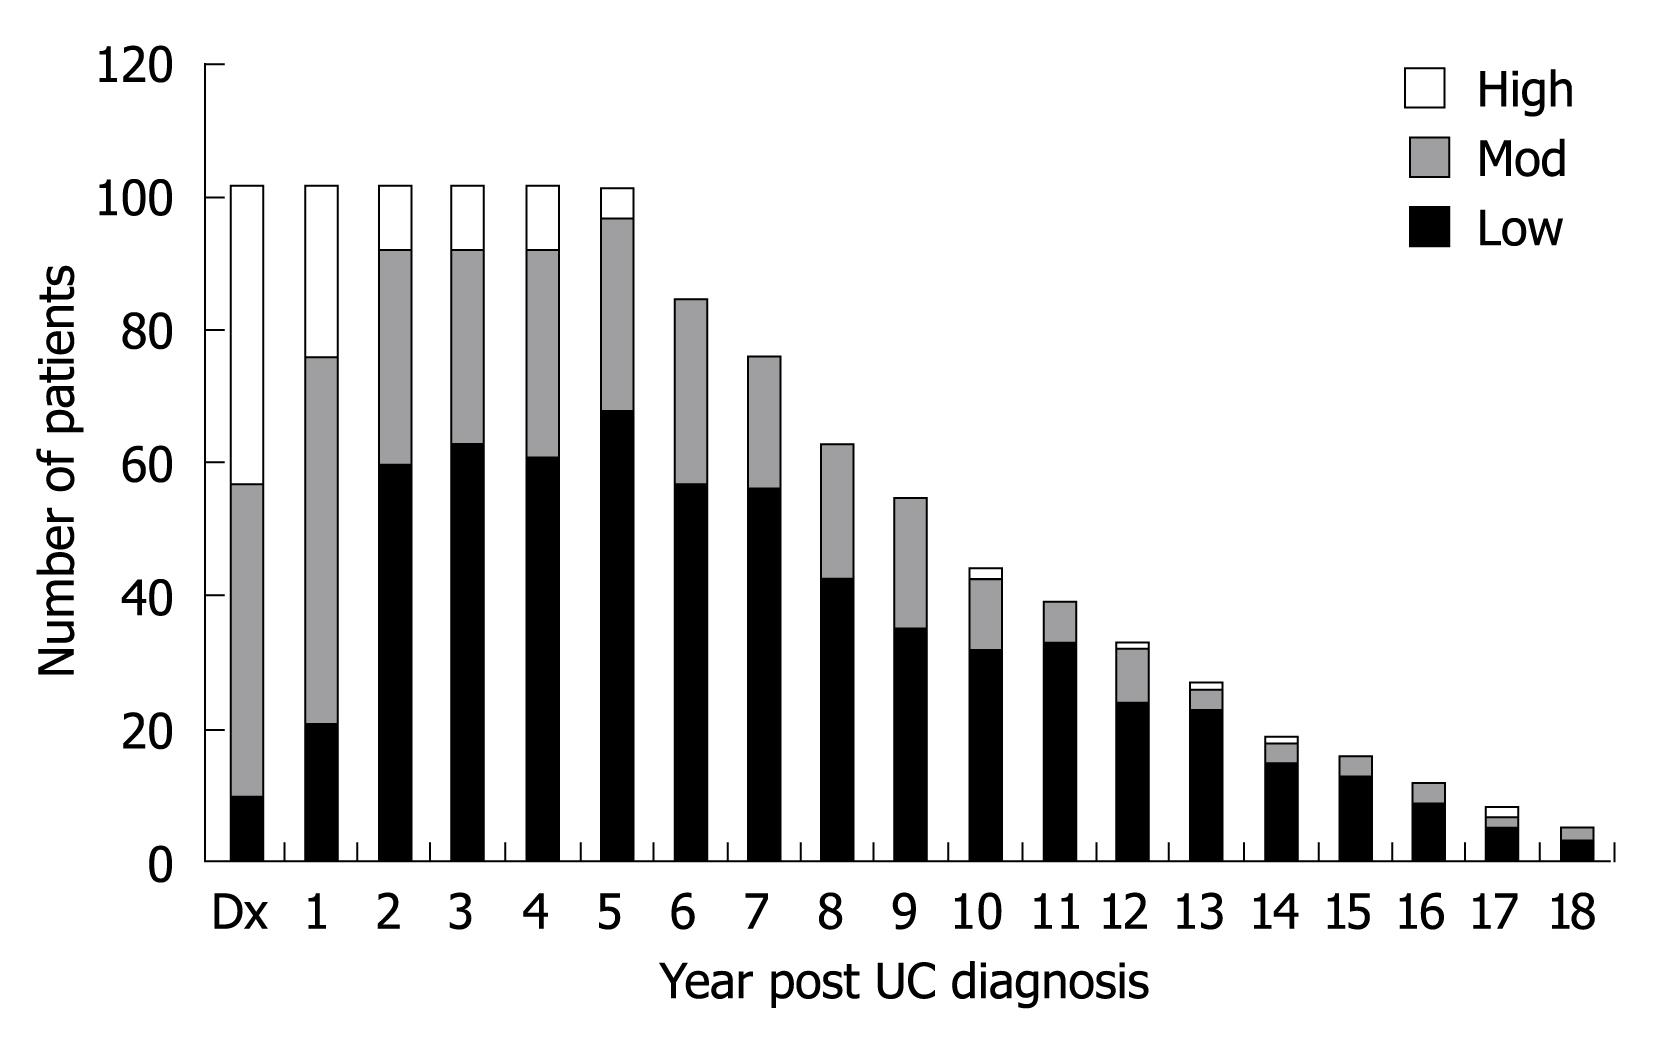
Figure 5 Ulcerative colitis disease severity at time of diagnosis and during follow up divided into 3 categories: low severity (modified Mayo Score 0-2), moderate severity (modified Mayo Score 3-5), high severity (modified Maya Score 6-9).
- Citation: Roth LS, Chande N, Ponich T, Roth ML, Gregor J. Predictors of disease severity in ulcerative colitis patients from Southwestern Ontario. World J Gastroenterol 2010; 16(2): 232-236
- URL: https://www.wjgnet.com/1007-9327/full/v16/i2/232.htm
- DOI: https://dx.doi.org/10.3748/wjg.v16.i2.232


