©2010 Baishideng.
World J Gastroenterol. Jan 14, 2010; 16(2): 167-175
Published online Jan 14, 2010. doi: 10.3748/wjg.v16.i2.167
Published online Jan 14, 2010. doi: 10.3748/wjg.v16.i2.167
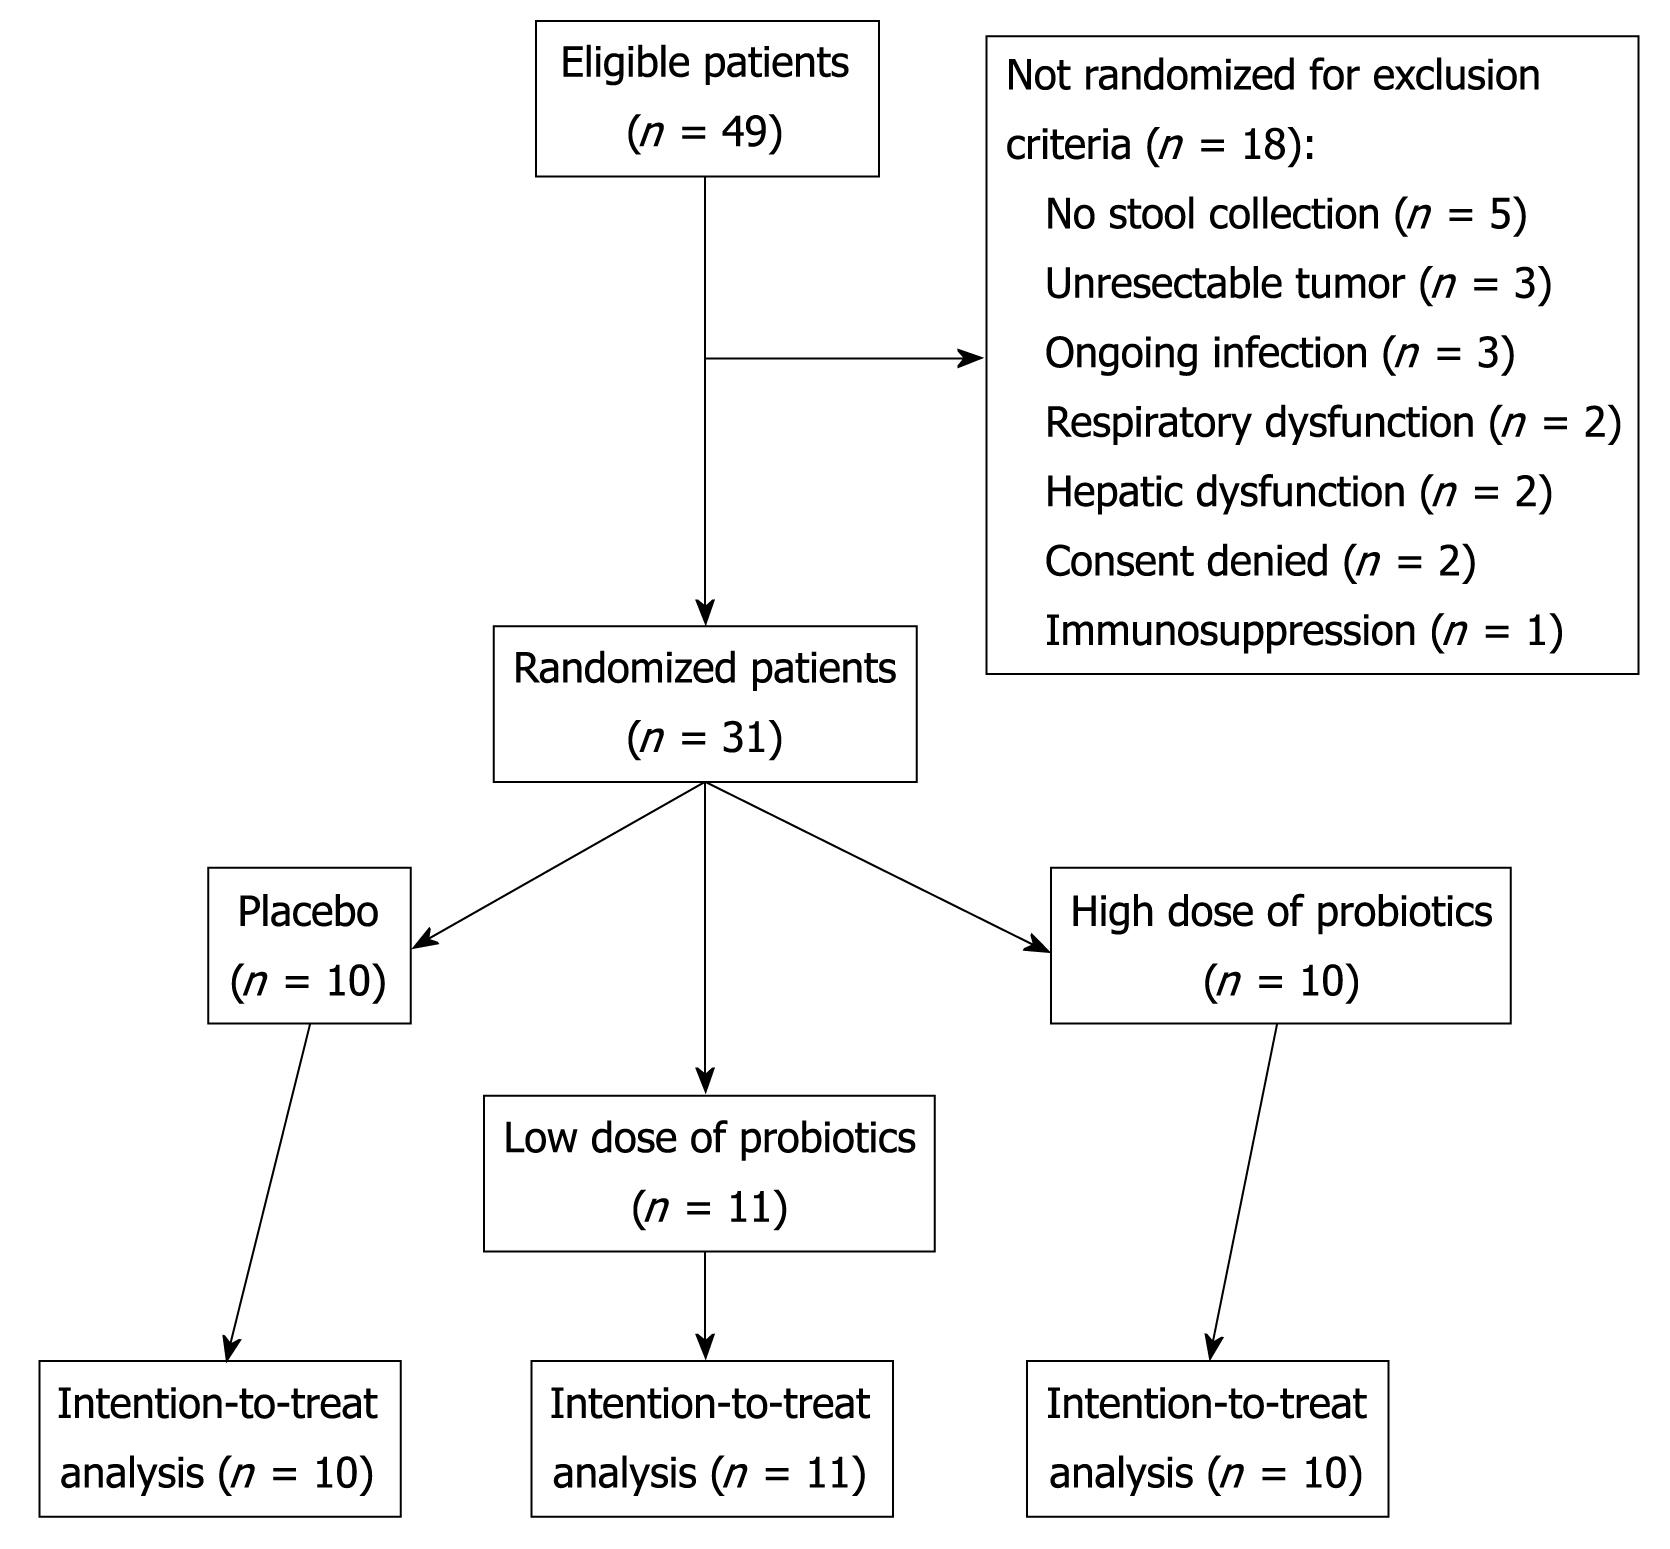
Figure 1 Study diagram according to CONSORT statement.
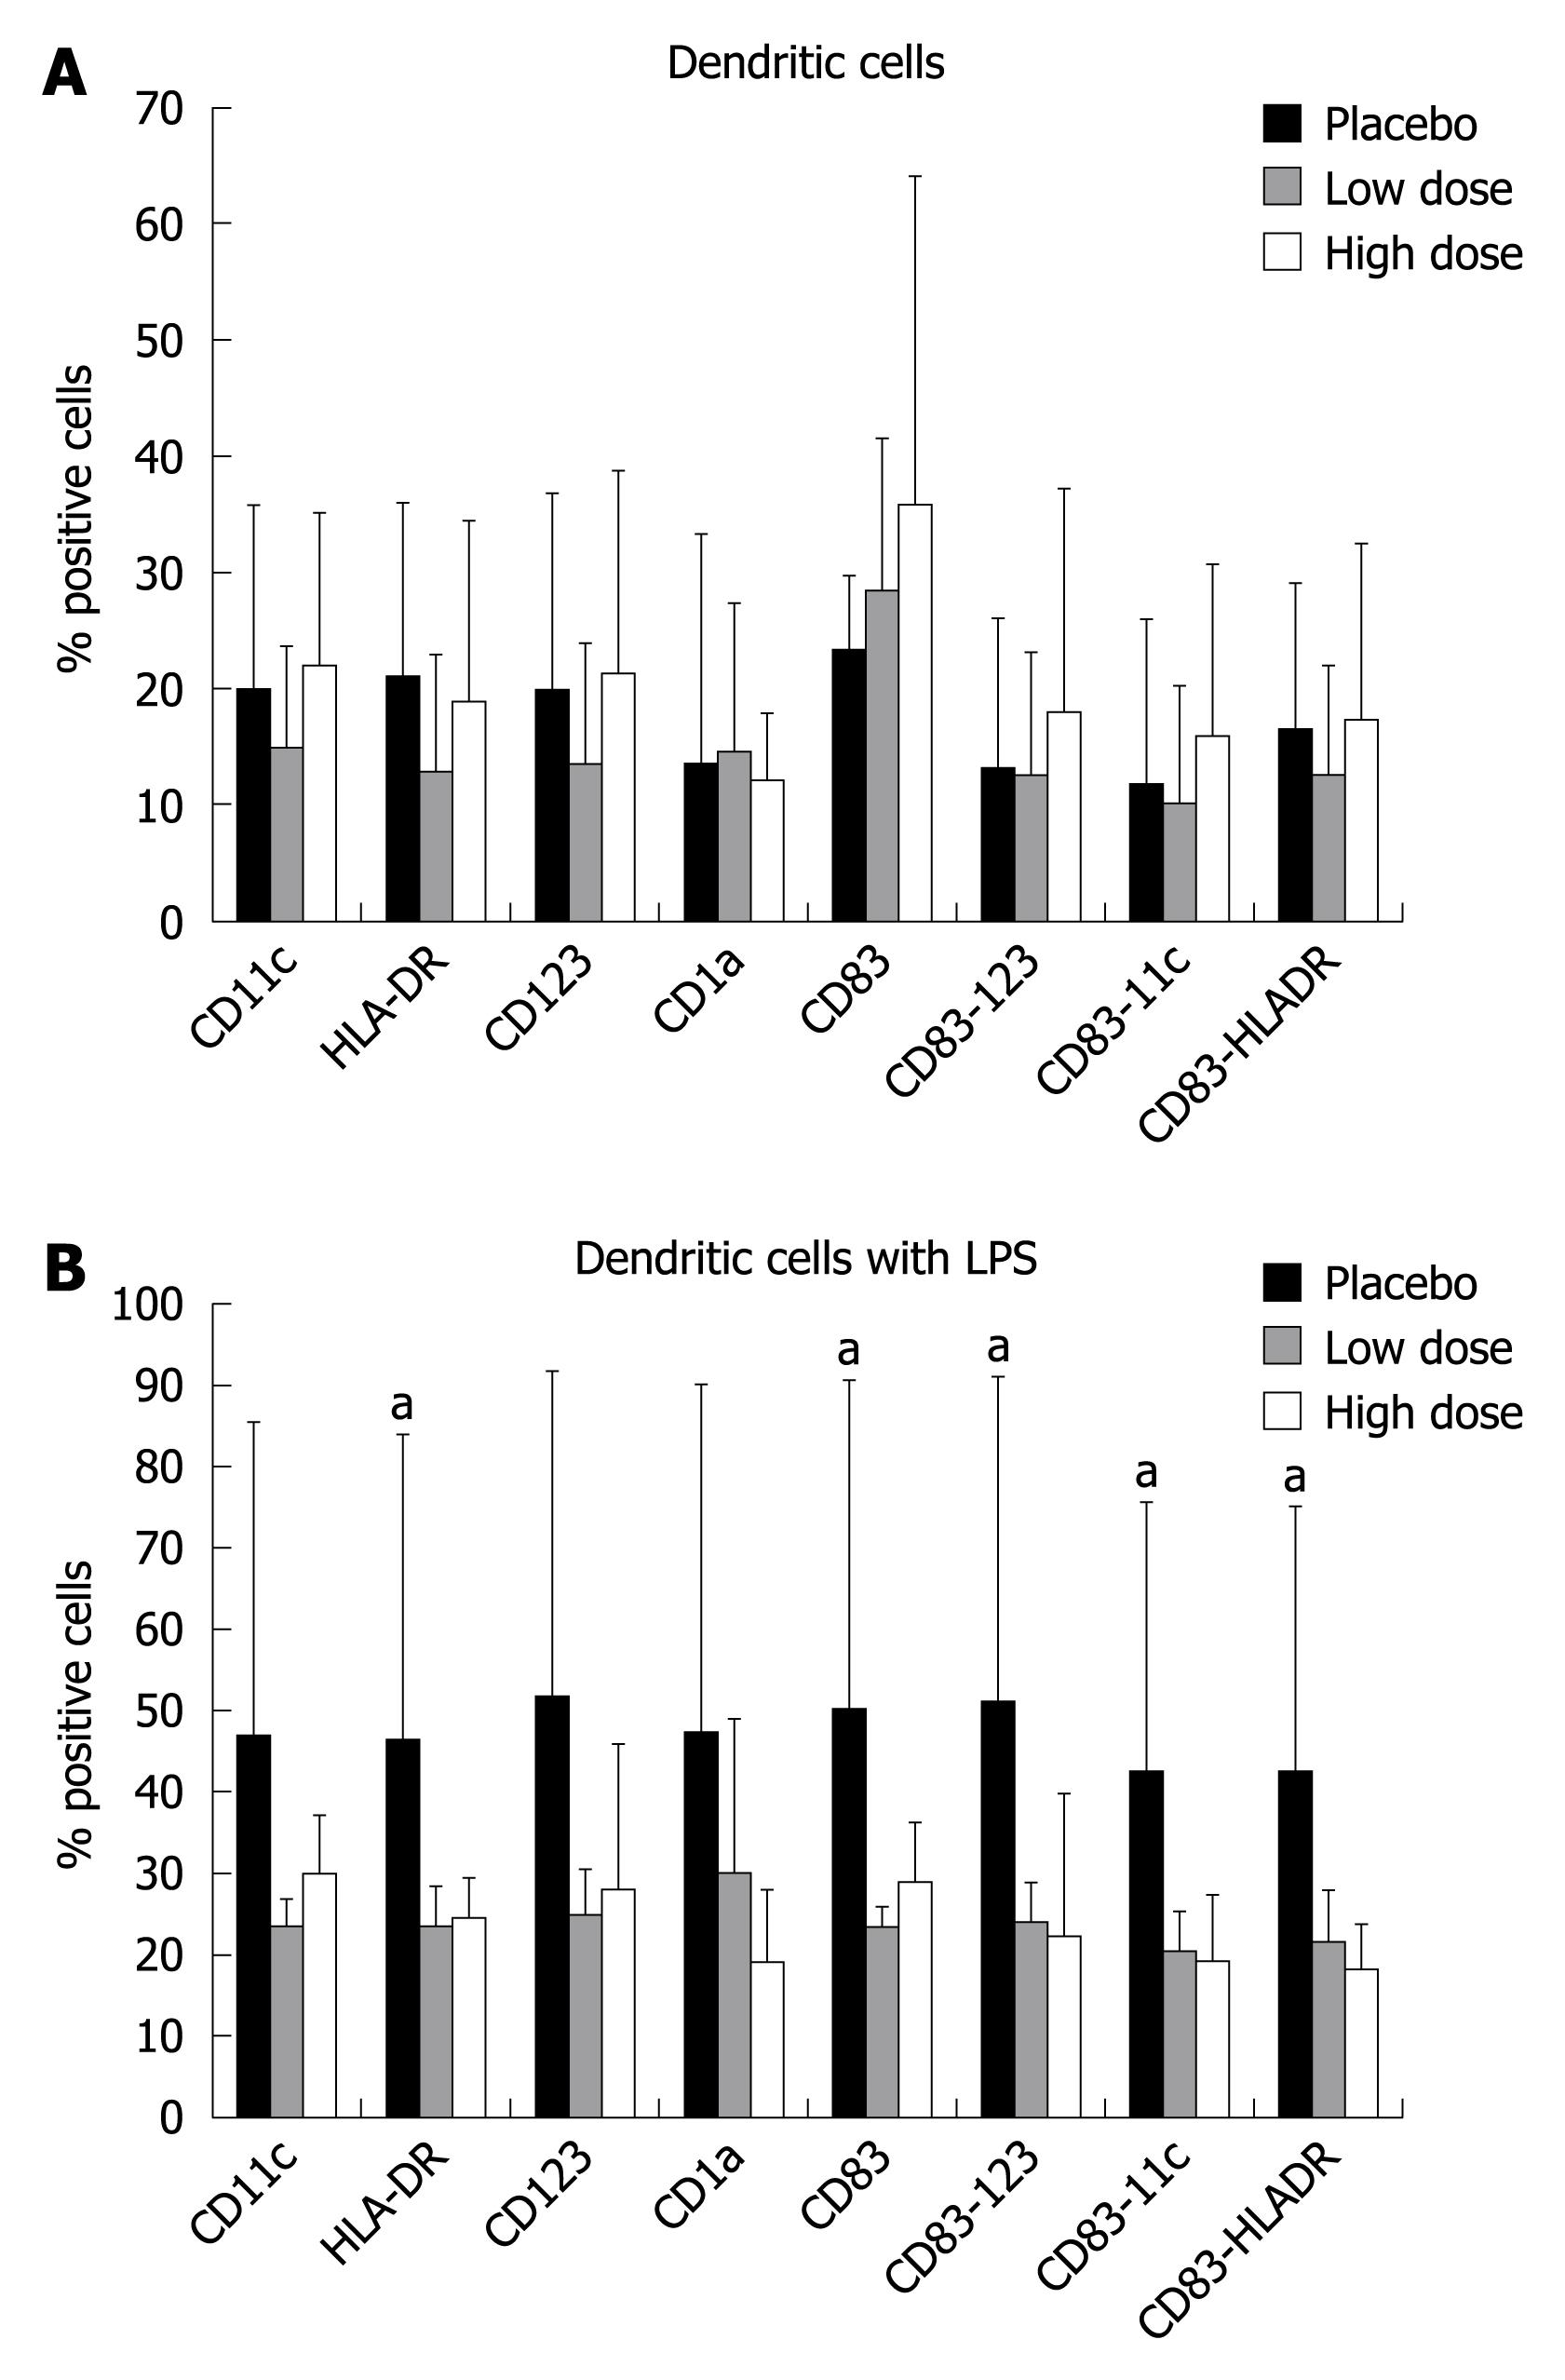
Figure 2 Percent of positive dendritic cell subsets of the three groups.
A: Ex vivo analysis; B: In vitro analysis after lipopolysaccharide (LPS) stimulation. aMinimum P = 0.04 vs low and high dose.
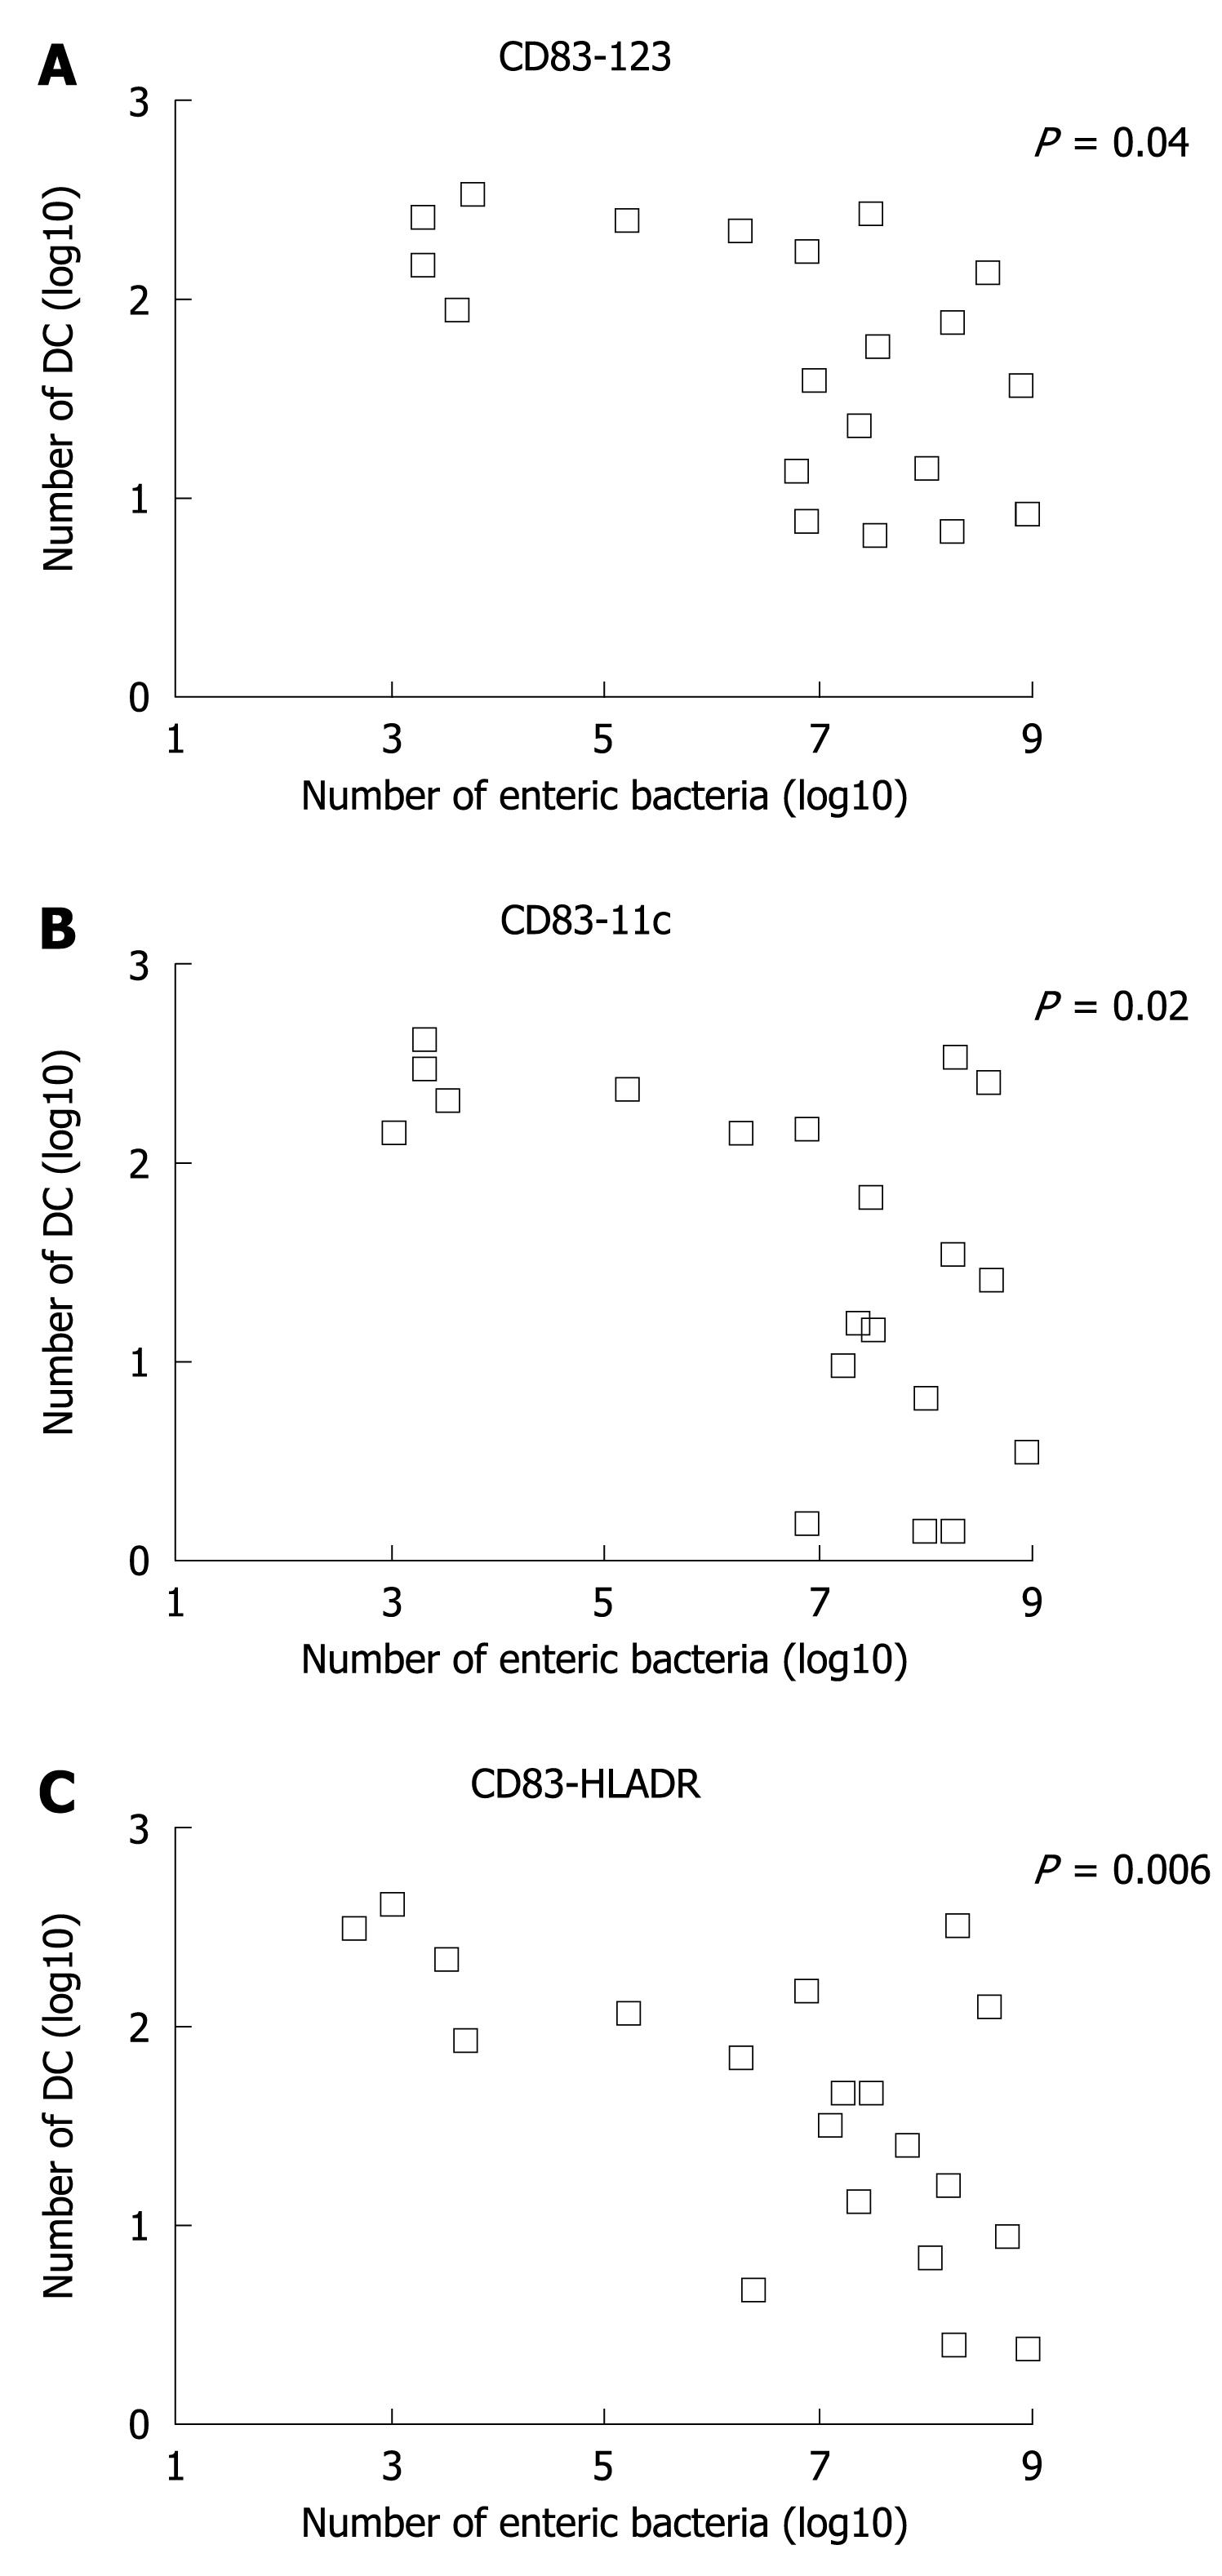
Figure 3 Correlation between number of colonic dendritic cells (DCs) and number of bacteria in feces.
A: Phenotype CD83-123; B: Phenotype CD83-11c; C: Phenotype CD83-HLADR.
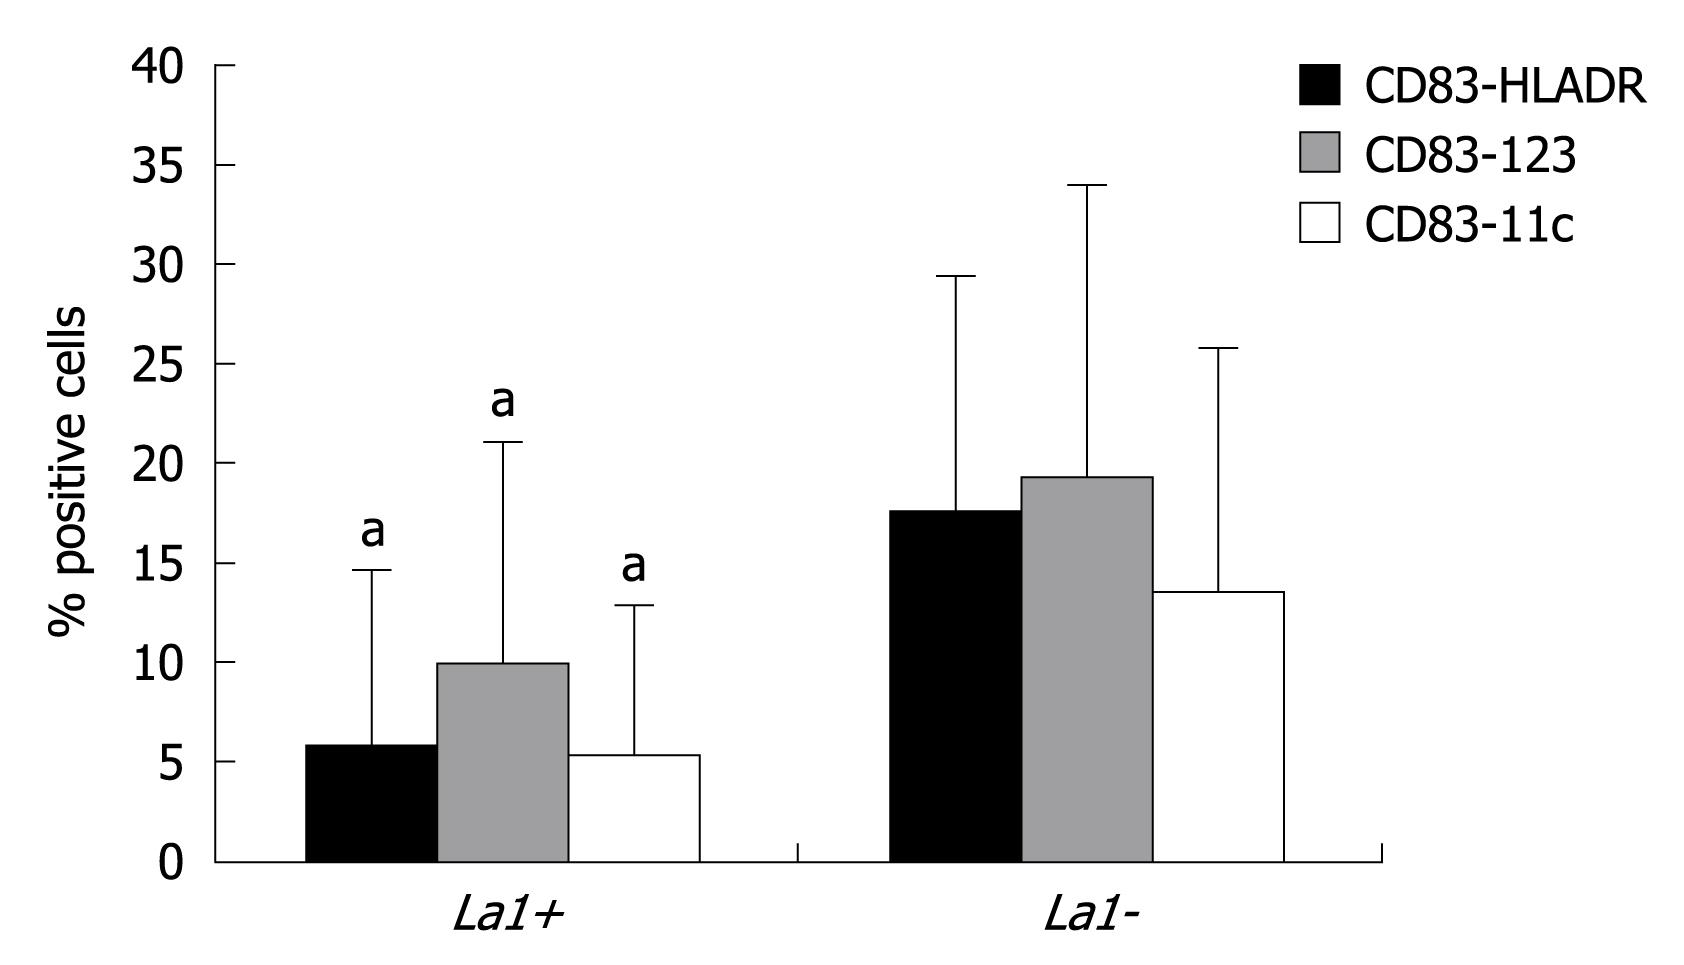
Figure 4 Percent of positive subsets of DCs in Lactobacillus johnsonii (La1) colonized patients (La1+) vs non-colonized patients (La1-).
aMinimum P = 0.03 La1+ vs La1-.
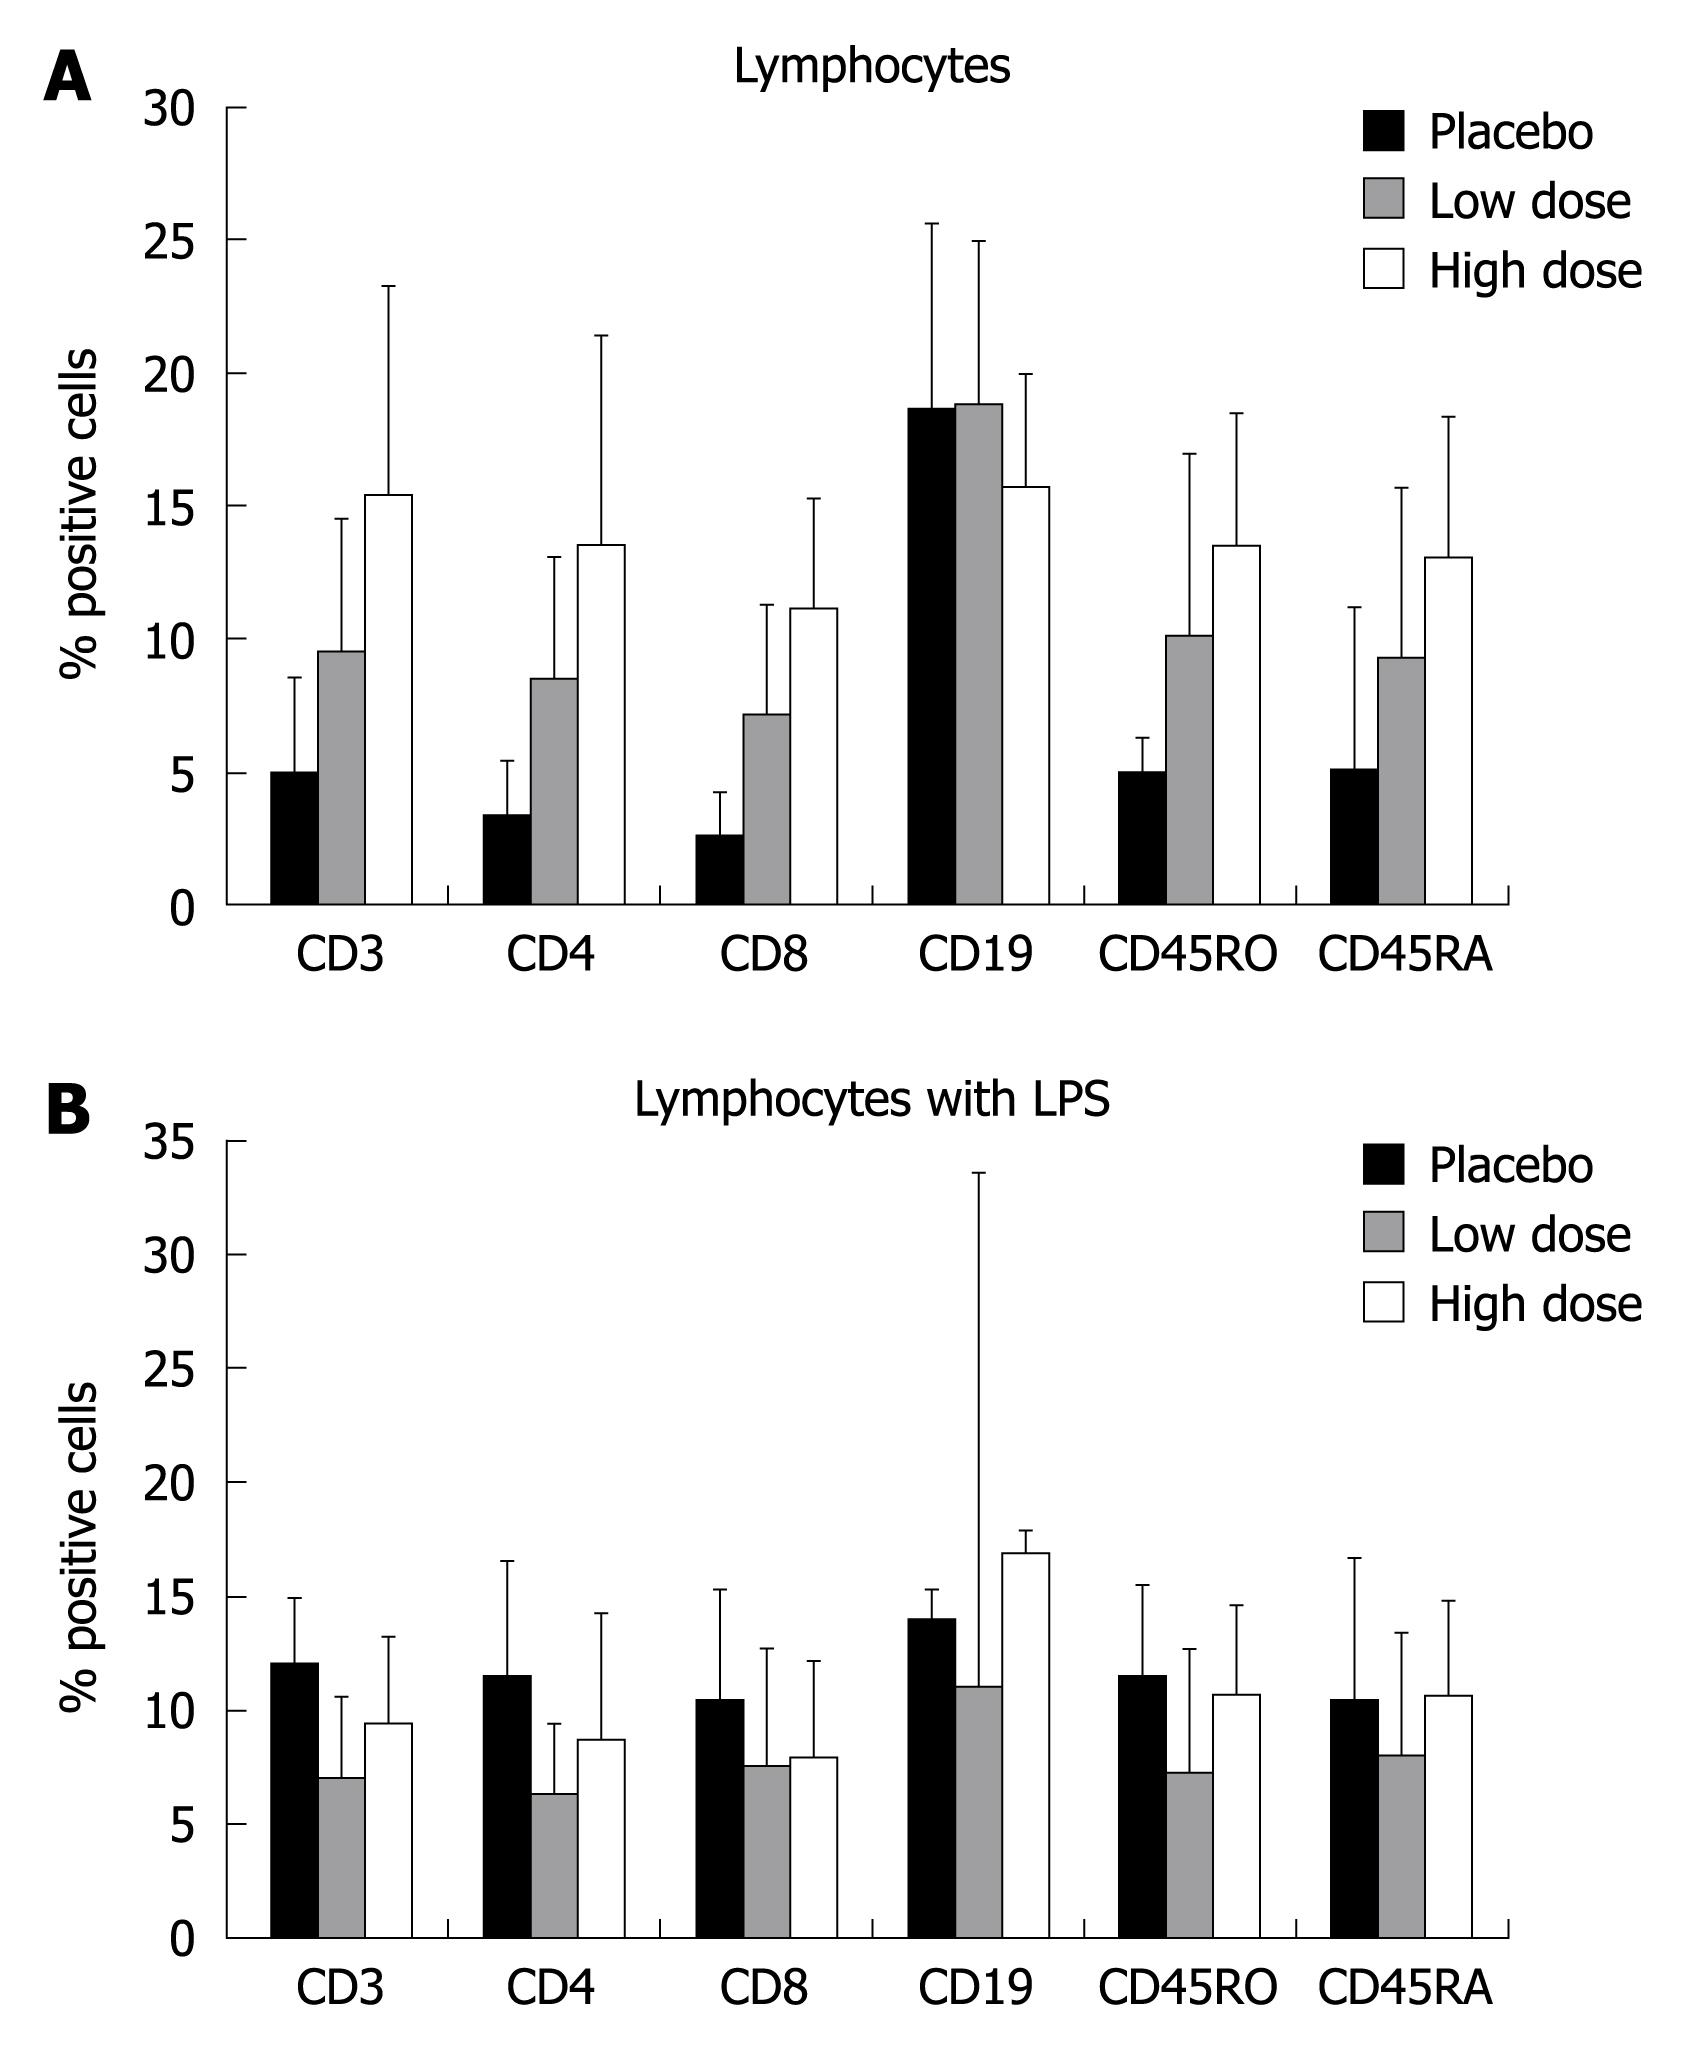
Figure 5 Percent of positive lymphocyte populations of the three groups.
A: Ex vivo analysis; B: In vitro analysis after LPS stimulation.
- Citation: Gianotti L, Morelli L, Galbiati F, Rocchetti S, Coppola S, Beneduce A, Gilardini C, Zonenschain D, Nespoli A, Braga M. A randomized double-blind trial on perioperative administration of probiotics in colorectal cancer patients. World J Gastroenterol 2010; 16(2): 167-175
- URL: https://www.wjgnet.com/1007-9327/full/v16/i2/167.htm
- DOI: https://dx.doi.org/10.3748/wjg.v16.i2.167


