©2009 The WJG Press and Baishideng.
World J Gastroenterol. Dec 28, 2009; 15(48): 6034-6043
Published online Dec 28, 2009. doi: 10.3748/wjg.15.6034
Published online Dec 28, 2009. doi: 10.3748/wjg.15.6034
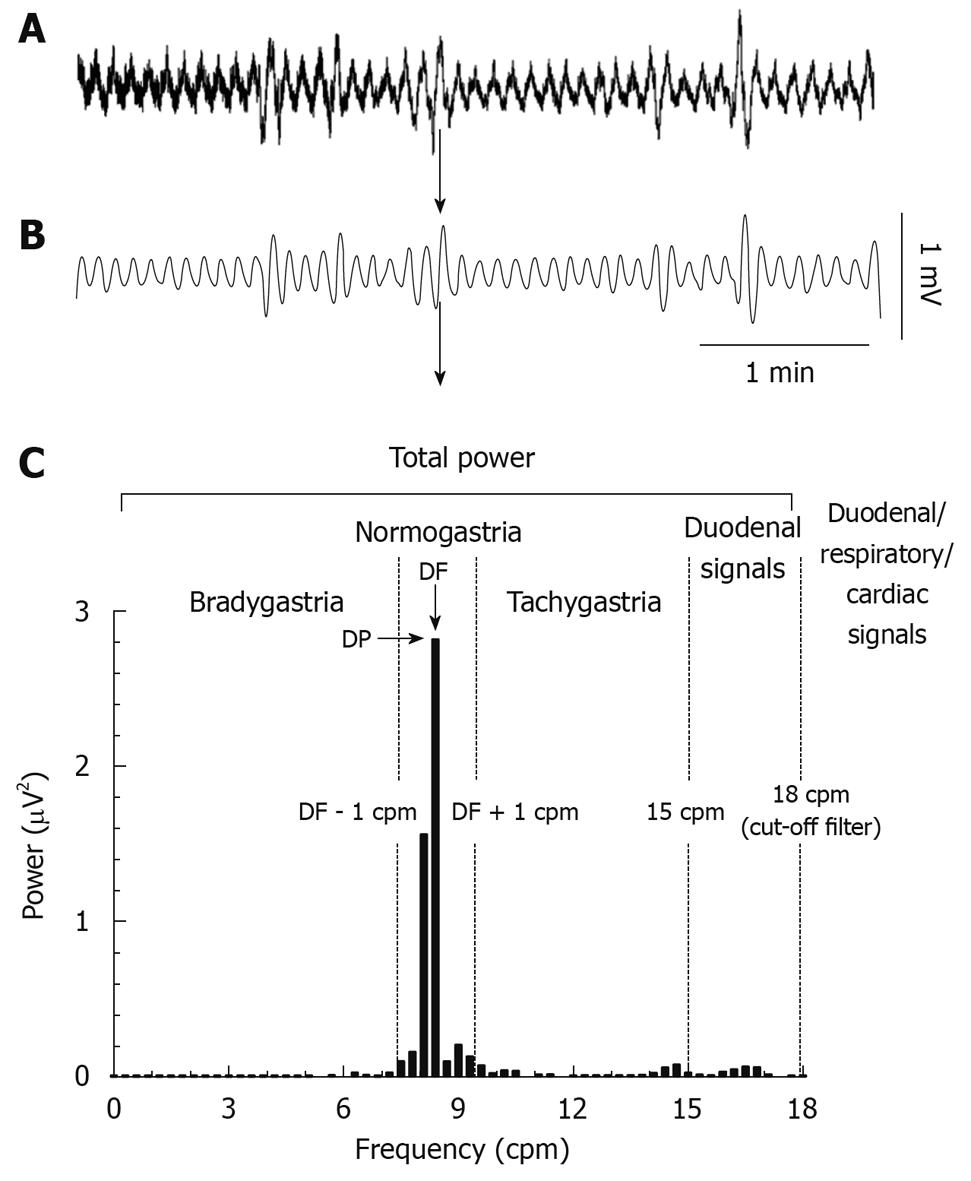
Figure 1 Telemetric recordings of the ferret gastric myoelectric activity and spectral analysis.
A: The raw trace sampled at 1 kHz; B: The same trace after filtering (low pass filter, cut-off: 0.3 Hz; sampling frequency 10 Hz); C: The fast Fourier transform of the same 5 min of data (Hann window, 2048). DF: Dominant frequency; DP: Dominant power; cpm: Counts/min; Total power: Total power contained in all the frequency bins between 0 and 18 cpm.
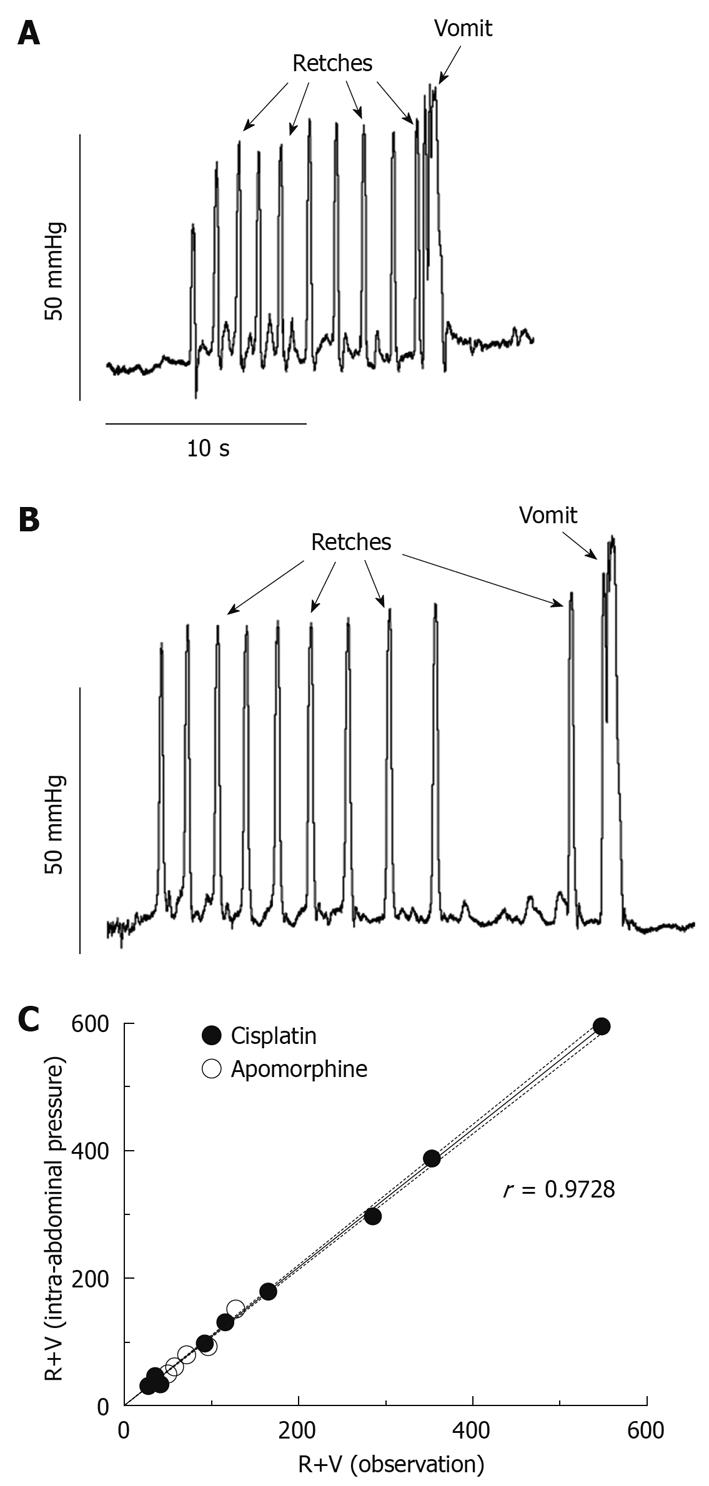
Figure 2 Intra-abdominal pressure recordings.
Intra-abdominal pressure was recorded via a telemetry transmitter in the abdominal cavity (C50-PTX, DSI®), showing emetic episodes-each composed of several retches and one vomit-induced by apomorphine (0.25 mg/kg sc) (A) and cisplatin (10 mg/kg ip) (B). Both recordings were obtained from the same animal. C: Correlation between the number of retches + vomits (R+V) induced by cisplatin (10 mg/kg ip) and apomorphine (0.25 mg/kg sc), quantified by direct observation and from the intra-abdominal pressure traces. Results plotted as individual values, n = 16 (data obtained from 11 animals). Spearman correlation coefficient (r), the linear regression (plain line) and 95% confidence interval (dotted line) are indicated on the graph.
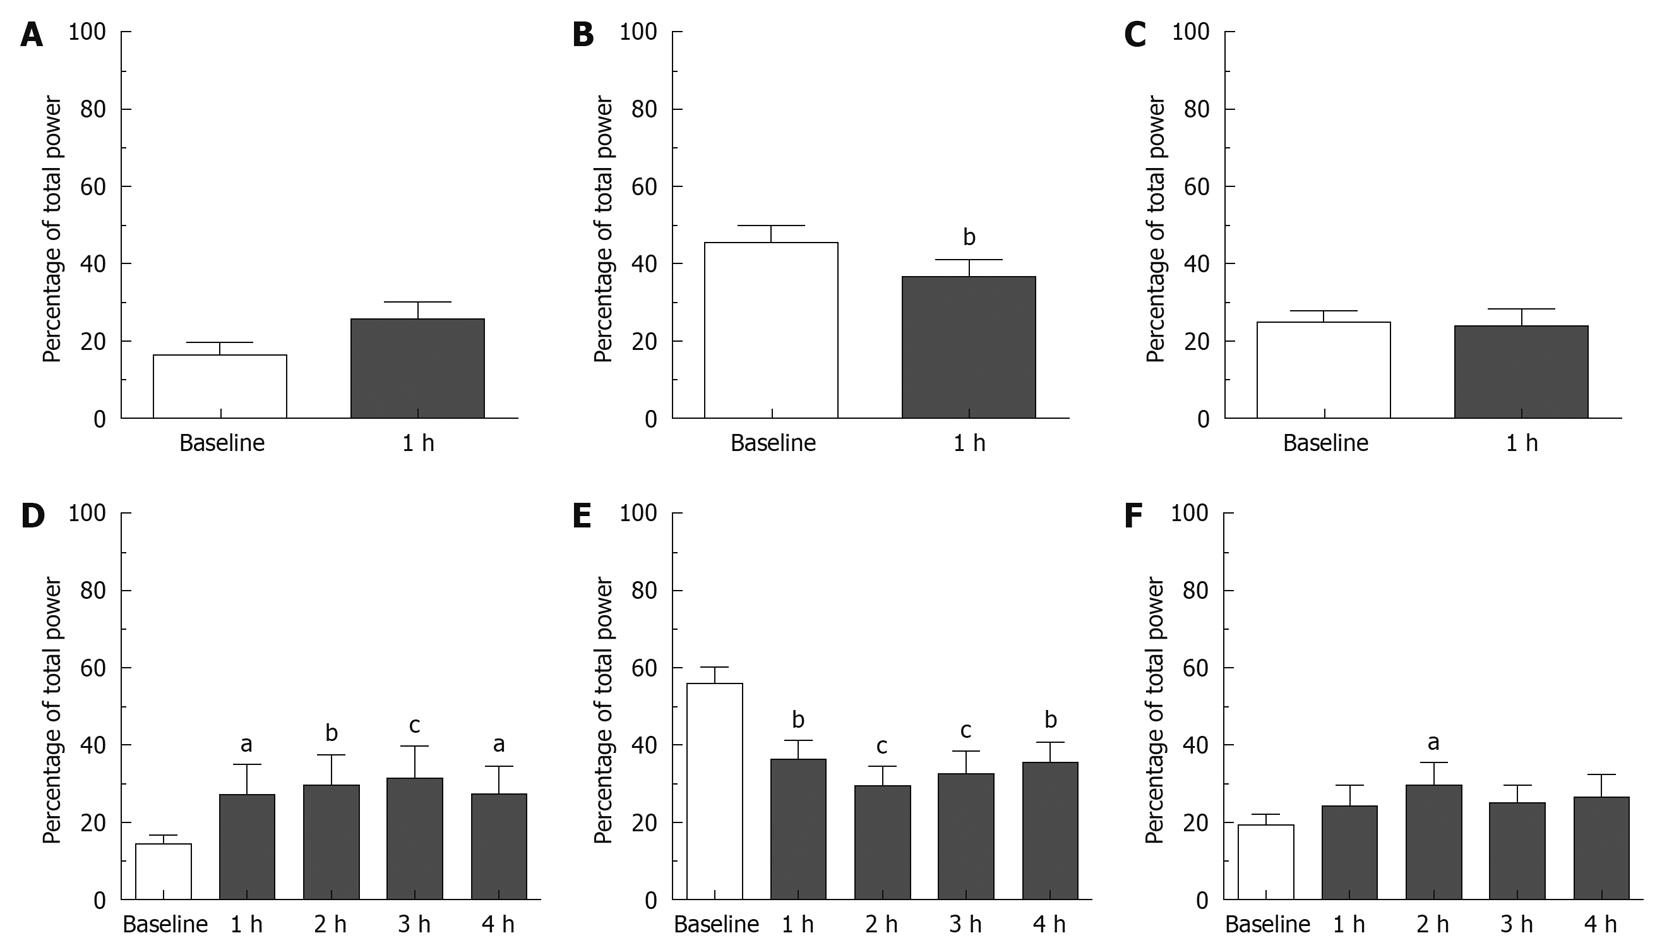
Figure 3 Effect of apomorphine (0.
25 mg/kg sc, A-C) and cisplatin (10 mg/kg ip, D-F) on the gastric myoelectric activity (GMA) in ferrets. The graphs represent the percentage of total (0-18 cpm) power in the bradygastric range [0 - (DF - 1 cpm), A and D], in the normogastric range [(DF - 1 cpm) - (DF + 1 cpm), B and E] and in the tachygastric range [(DF + 1 cpm) - 15 cpm, C and F]. Results are plotted as mean ± SE (n = 8). Differences compared to the effect of a dose of saline (sc or ip as appropriate, data not shown on this graph) were computed using two-way ANOVA (factors: treatment and time) and Bonferroni post-tests, Differences with baseline are indicated as aP < 0.05, bP < 0.01, cP < 0.001.
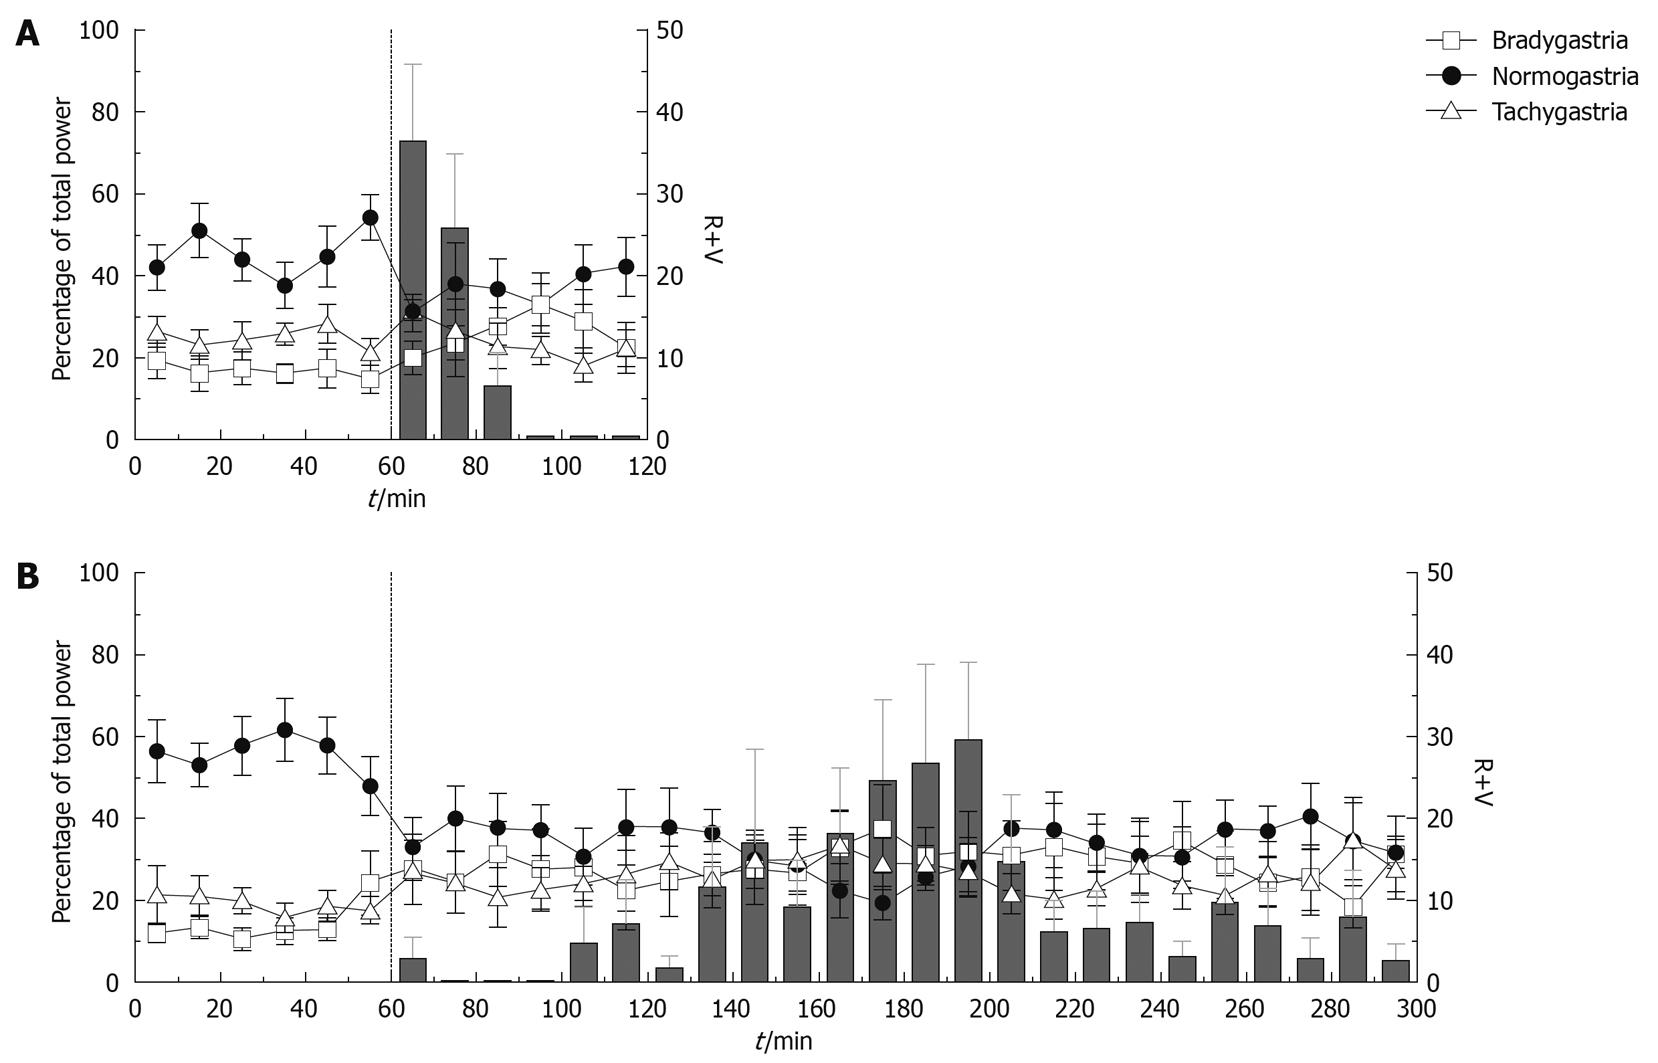
Figure 4 Profile of emesis and GMA repartition in the bradygastric, normogastric and tachygastric ranges following the administration of apomorphine (0.
25 mg/kg sc) (A) and cisplatin (10 mg/kg ip) (B) in the ferret. Data plotted as mean ± SE per 10 min, n = 8.
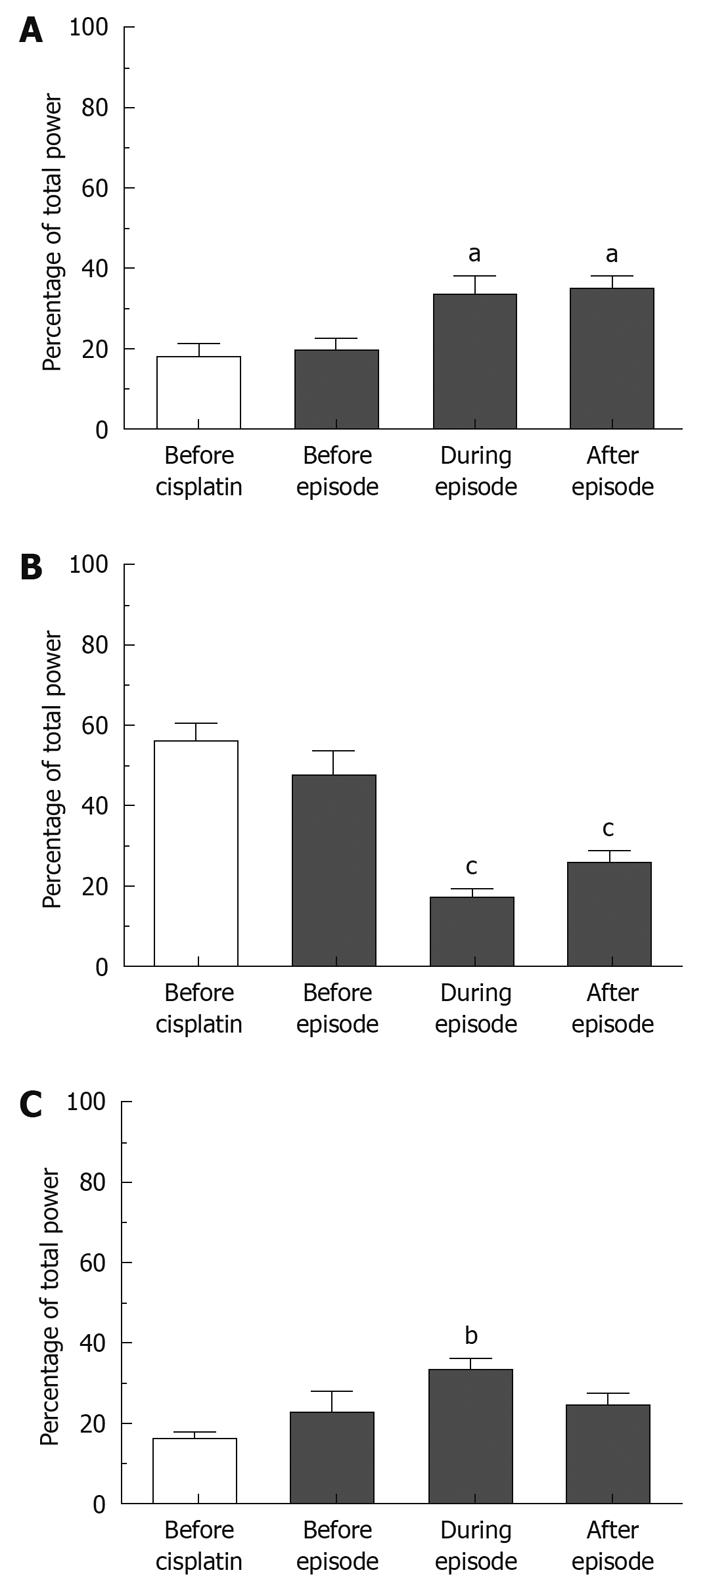
Figure 5 Repartition of the GMA in the bradygastric (A), normogastric (B) and tachygastric (C) ranges before the injection of cisplatin, immediately before emetic episodes, during emetic episodes and immediately after emetic episodes induced by cisplatin (10 mg/kg ip) in the ferret.
Results are plotted as mean ± SE, n = 8. Differences compared to baseline are calculated using repetitive measures one-way ANOVA followed by Bonferroni-post tests. aP < 0.05, bP < 0.01, cP < 0.001.
- Citation: Percie du Sert N, Chu KM, Wai MK, Rudd JA, Andrews PL. Reduced normogastric electrical activity associated with emesis: A telemetric study in ferrets. World J Gastroenterol 2009; 15(48): 6034-6043
- URL: https://www.wjgnet.com/1007-9327/full/v15/i48/6034.htm
- DOI: https://dx.doi.org/10.3748/wjg.15.6034


