Copyright
©2009 The WJG Press and Baishideng.
World J Gastroenterol. Nov 21, 2009; 15(43): 5432-5441
Published online Nov 21, 2009. doi: 10.3748/wjg.15.5432
Published online Nov 21, 2009. doi: 10.3748/wjg.15.5432
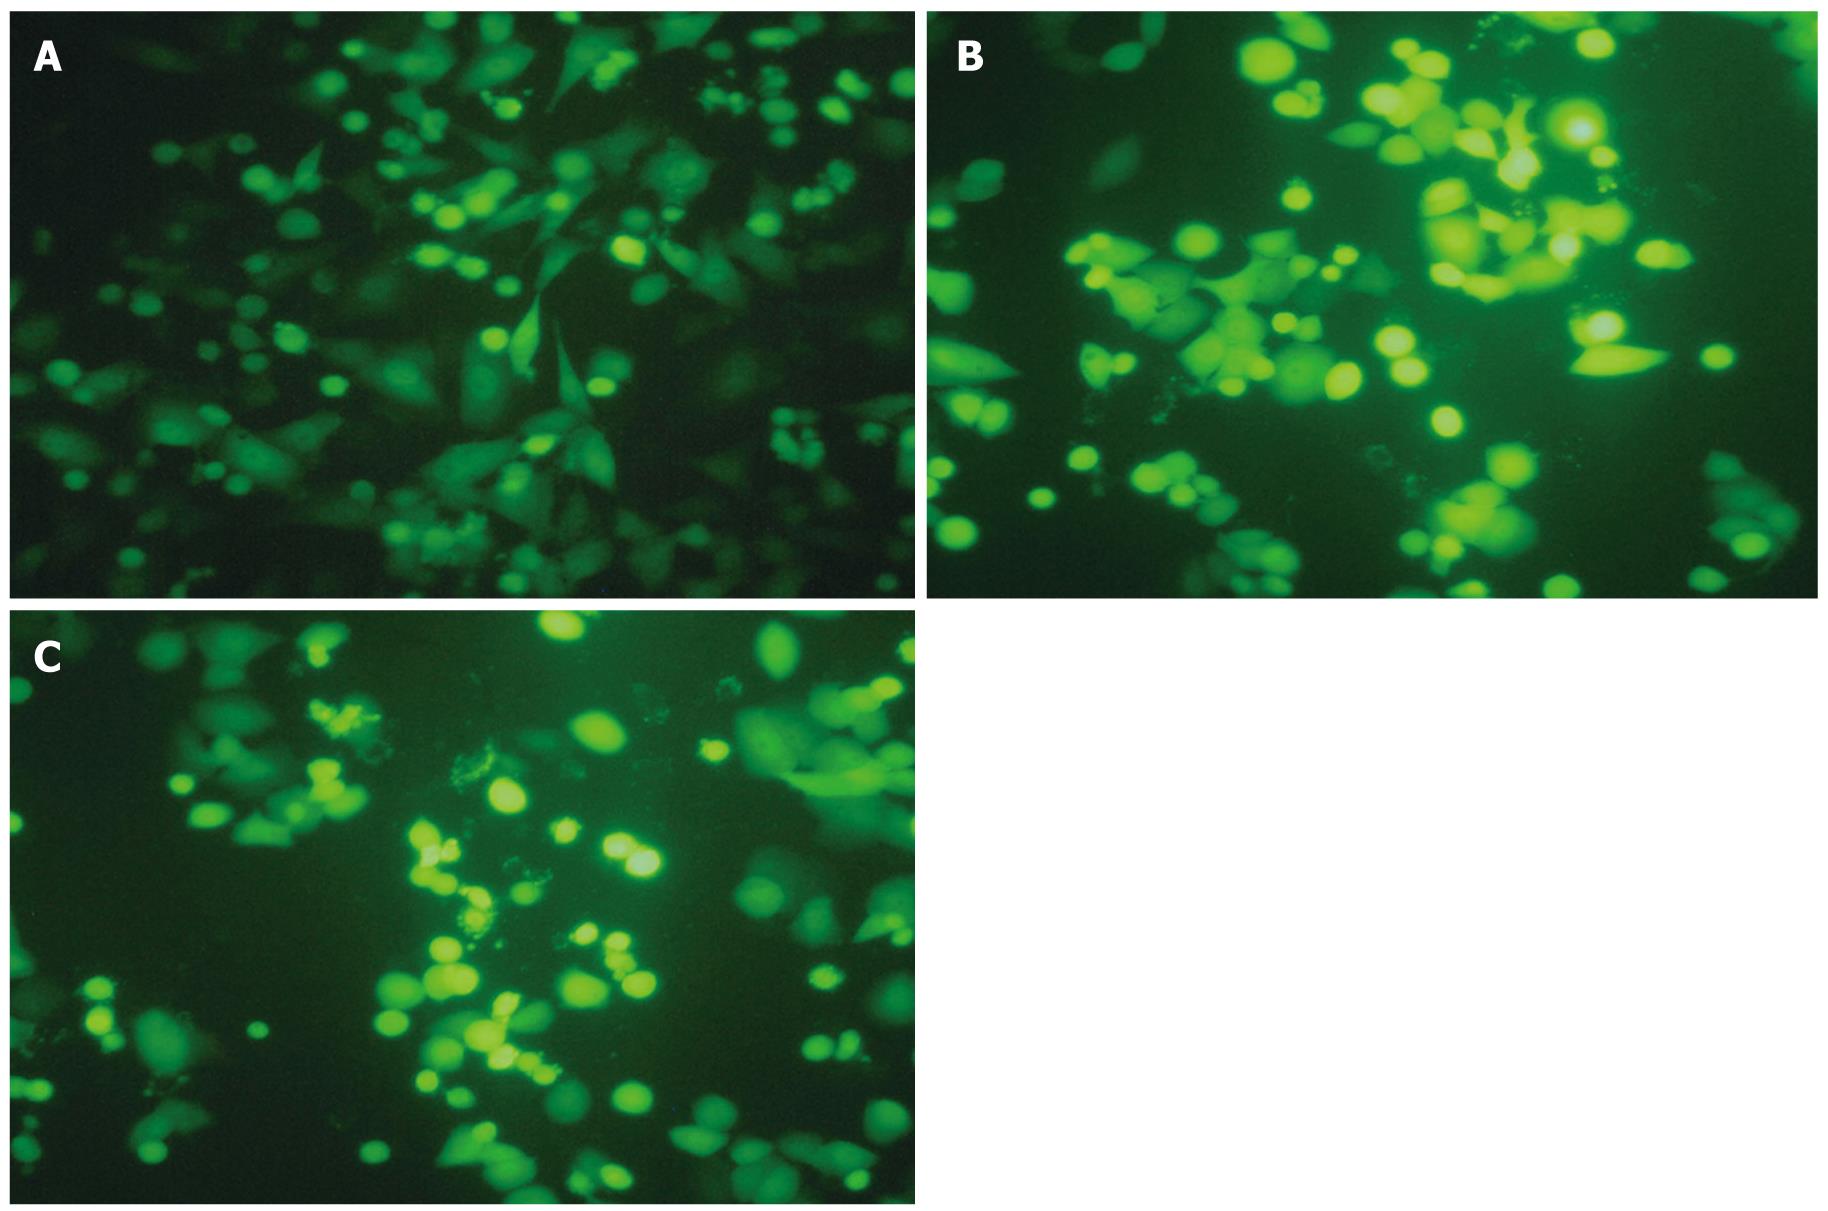
Figure 1 Expression of fluorescence in BGC-823 cells (× 200).
As MOI increased, so did the number of BGC-823 cells that expressed GFP protein. A: Nearly all the cells could be transfected when MOI was 20; B: Most cells became detached and died at MOI = 30; C: Most cells became detached and died at MOI = 50. Diagrams are representive of at least three independent experiments.
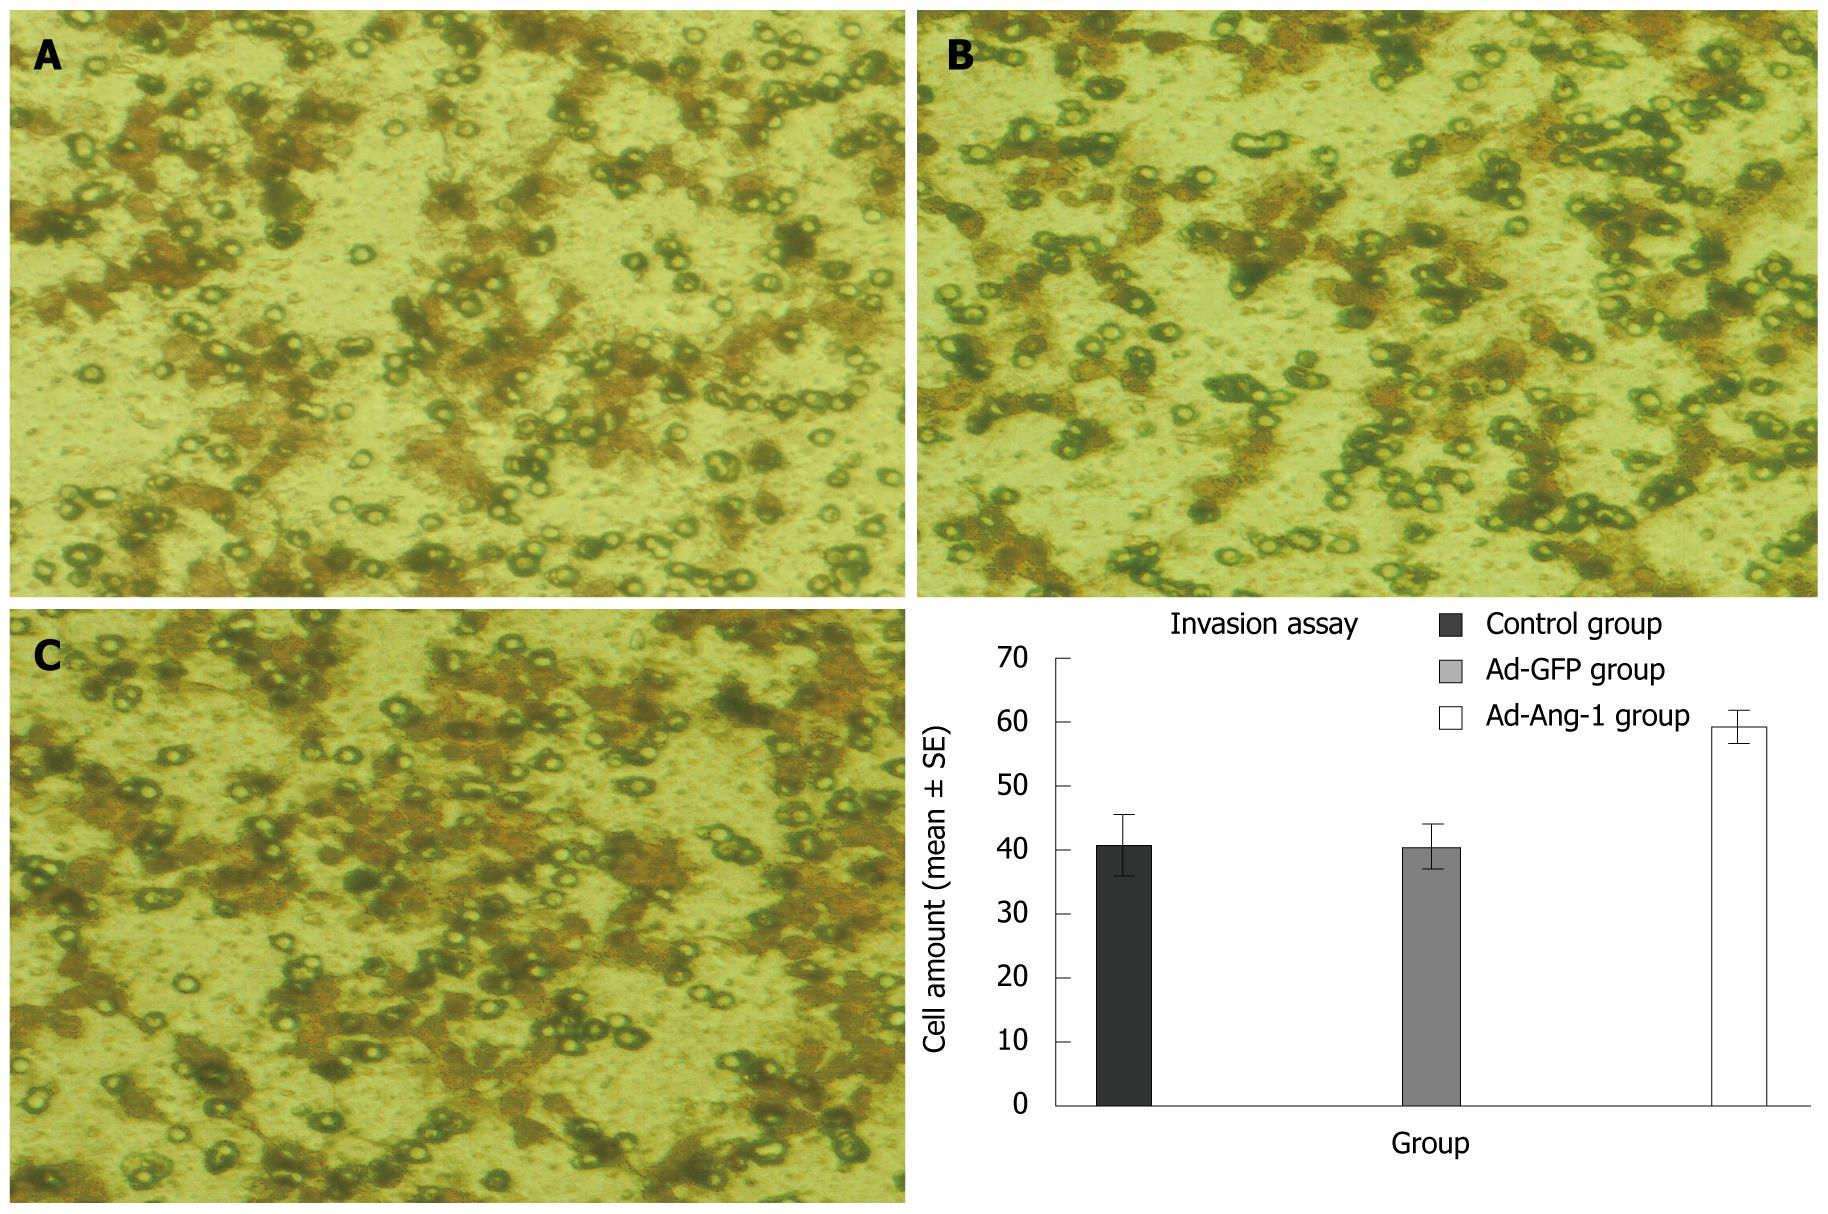
Figure 2 Invasion assay in BGC-823 cells (× 200).
A: Control group; B: Ad-GFP-transfected group; C: Ad-Ang-1-transfected group. There was no difference between the control and Ad-GFP groups. Ad-Ang-1-transfected cells had a significant increase in invasion compared with the mock-transfected and Ad-GFP groups (P < 0.05). Diagrams are representive of at least three independent experiments.
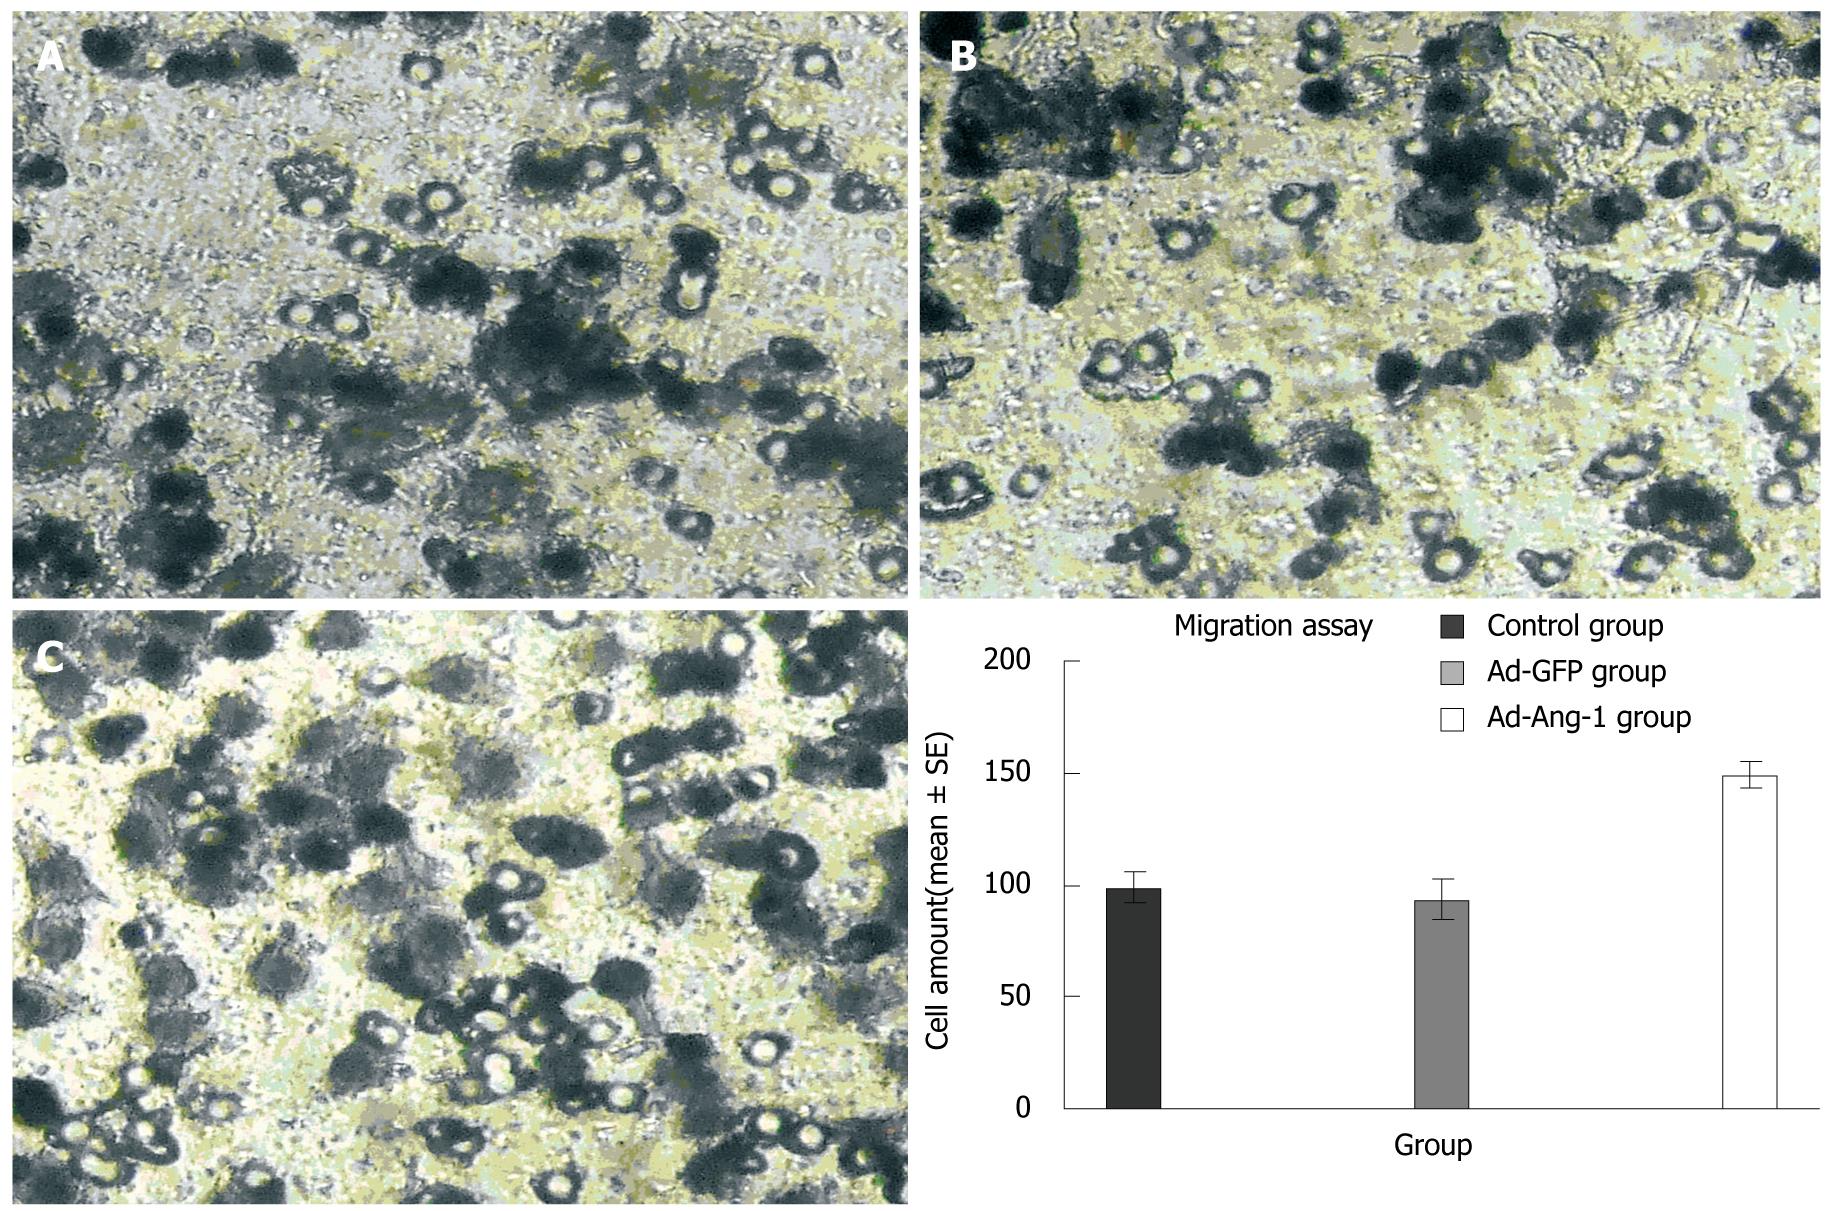
Figure 3 Migration assay in BGC-823 cells (× 200).
A: Control group; B: Ad-GFP-transfected group; C: Ad-Ang-1-transfected group. There was no difference between the control and Ad-GFP groups. In the Ad-Ang-1 group, there were more cells than in the control and Ad-GFP groups (P < 0.05). Diagrams are representive of at least three independent experiments.
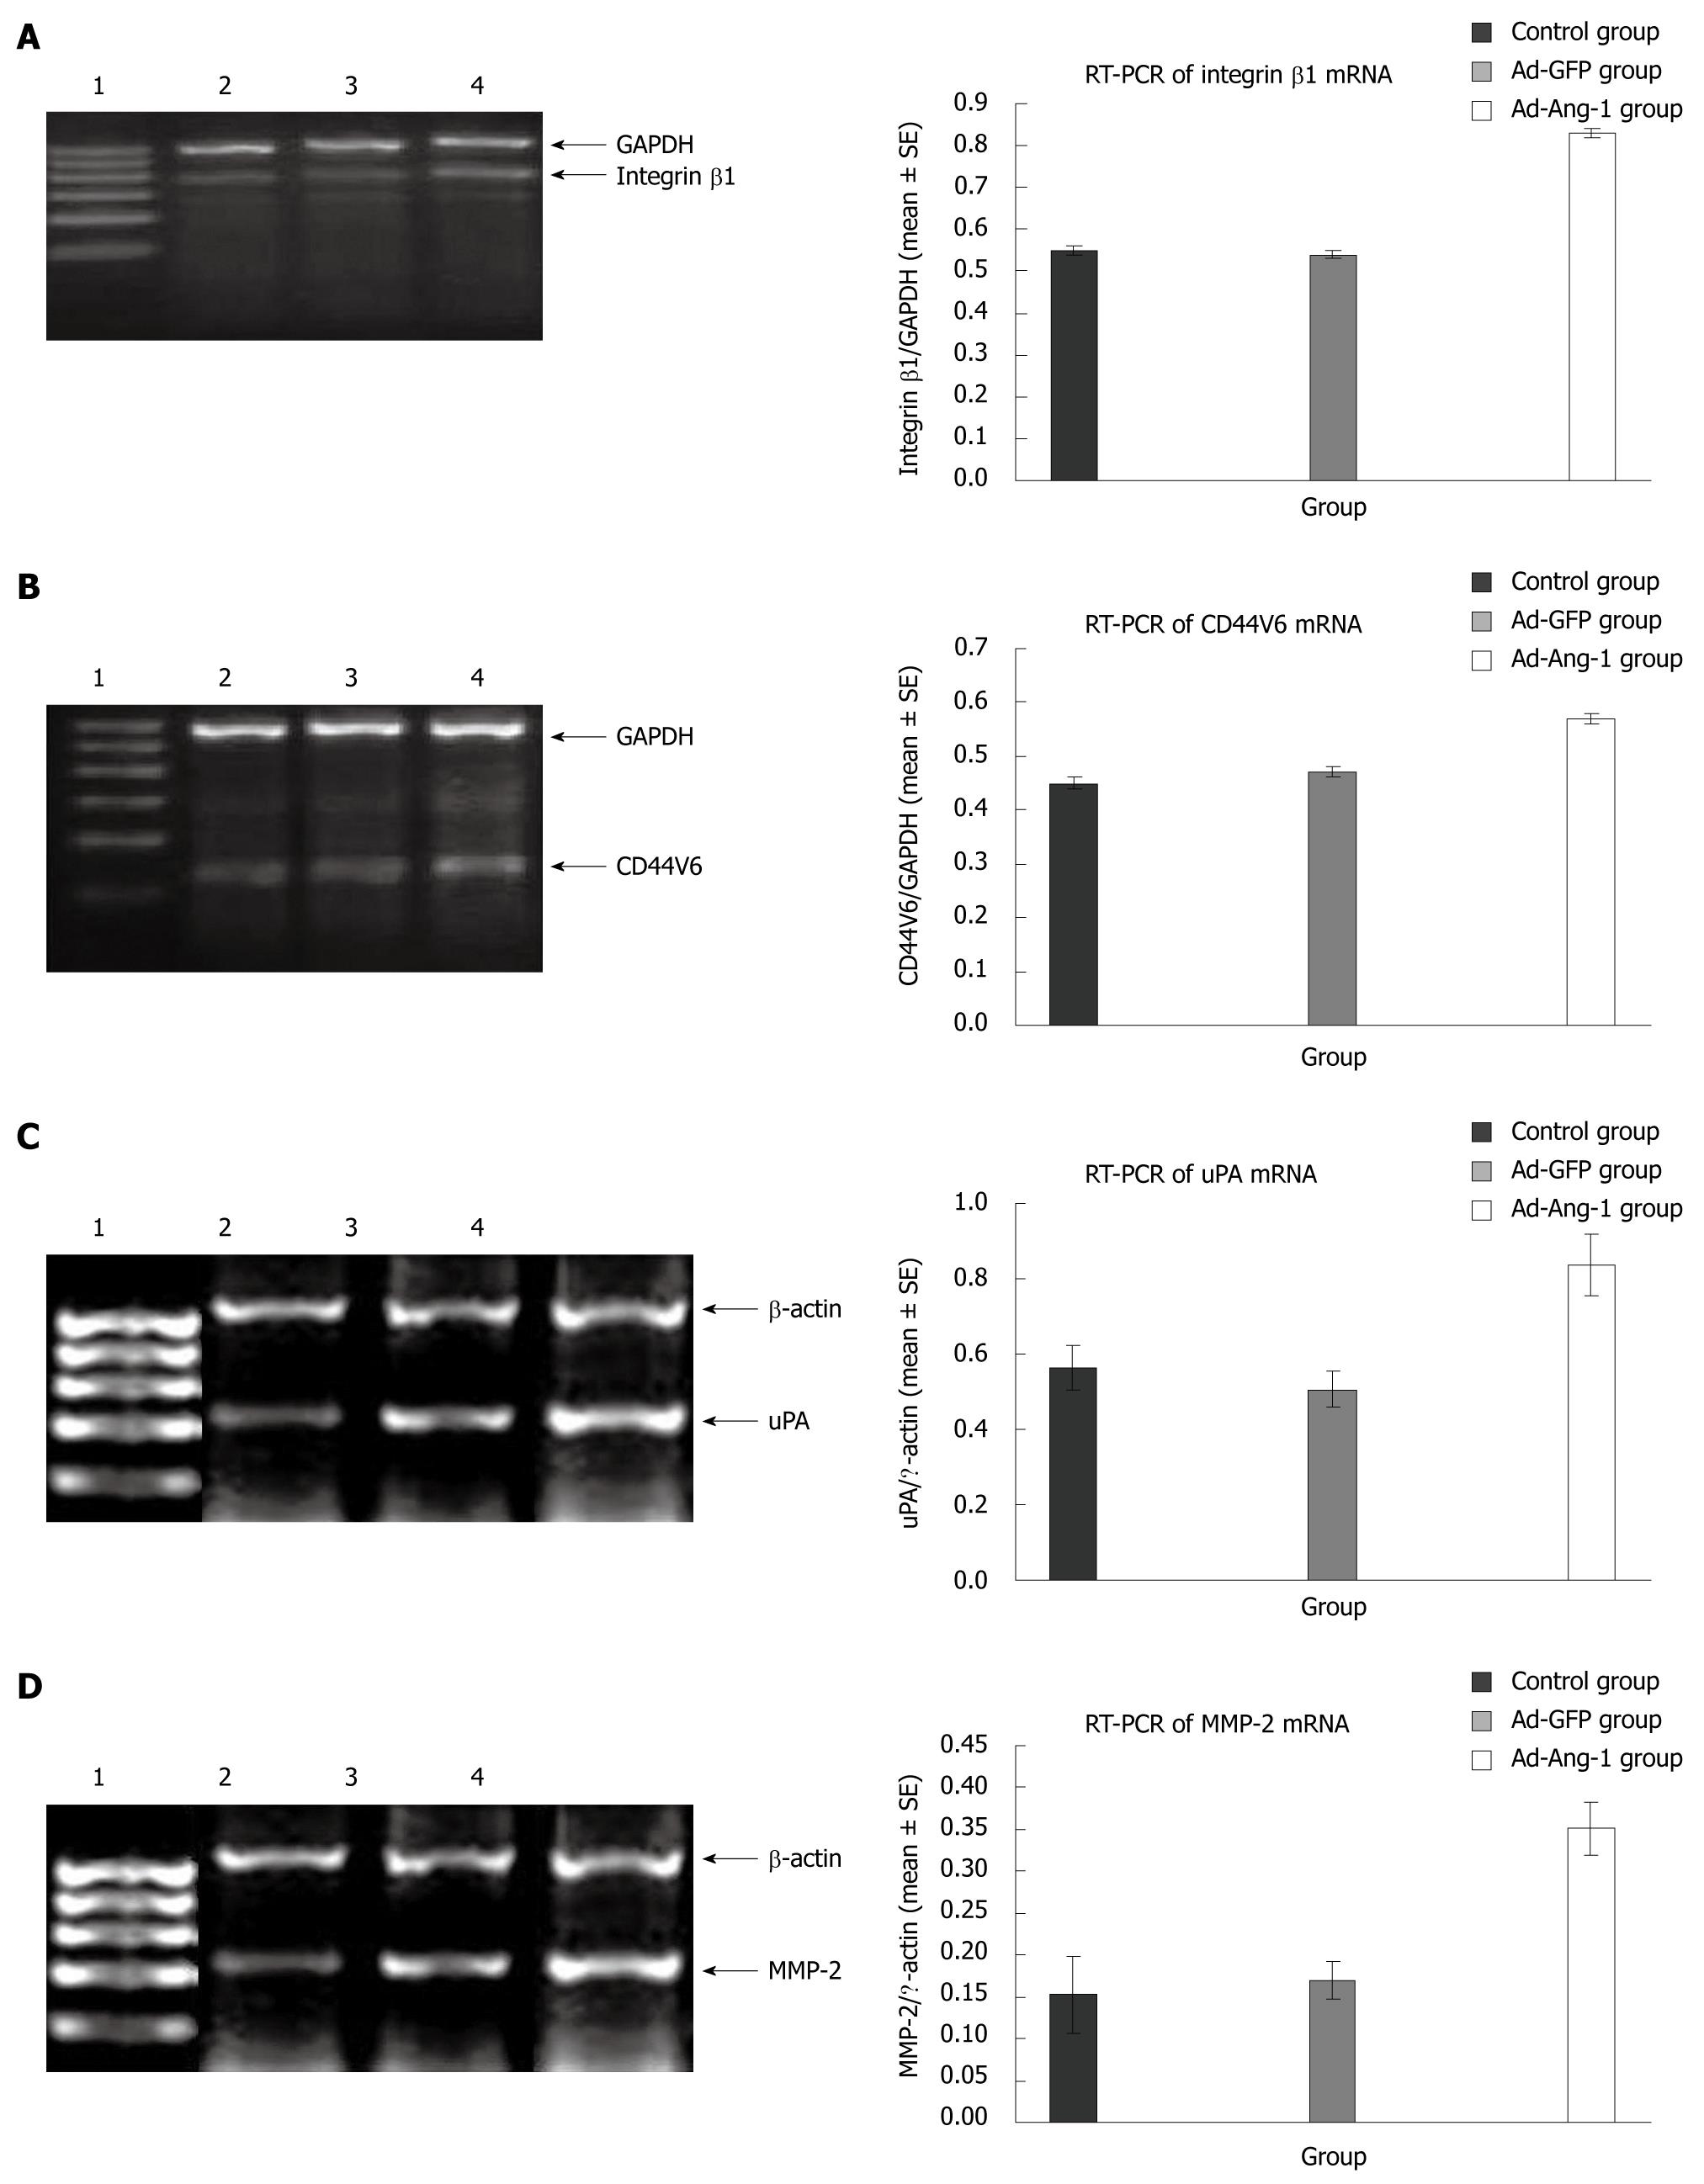
Figure 4 Expression of integrin β1 (A), CD44V6 (B), uPA (C) and MMP-2 (D) mRNA.
1: Markers: 100, 200, 300, 400, 500 and 600 bp; 2: Control group; 3: Ad-GFP-transfected group; 4: Ad-Ang-1-transfected group. A: Ang-1 group: 0.830 ± 0.010; control group and Ad-GFP group: 0.551 ± 0.009 and 0.543 ± 0.010, respectively; B: Ang-1 group: 0.570 ± 0.012; control group and Ad-GFP group: 0.451 ± 0.014 and 0.472 ± 0.013, respectively; C: Ang-1 group: 0.837 ± 0.081; control group and Ad-GFP group: 0.563 ± 0.059 and 0.506 ± 0.048, respectively; D: Ang-1 group: 0.351 ± 0.032; control group and Ad-GFP group: 0.153 ± 0.046 and 0.170 ± 0.023, respectively. These results show that the expression of integrin β1, CD44V6, uPA and MMP-2 mRNA was increased in the Ang-1 group (P < 0.05). Diagrams are representive of at least three independent experiments.
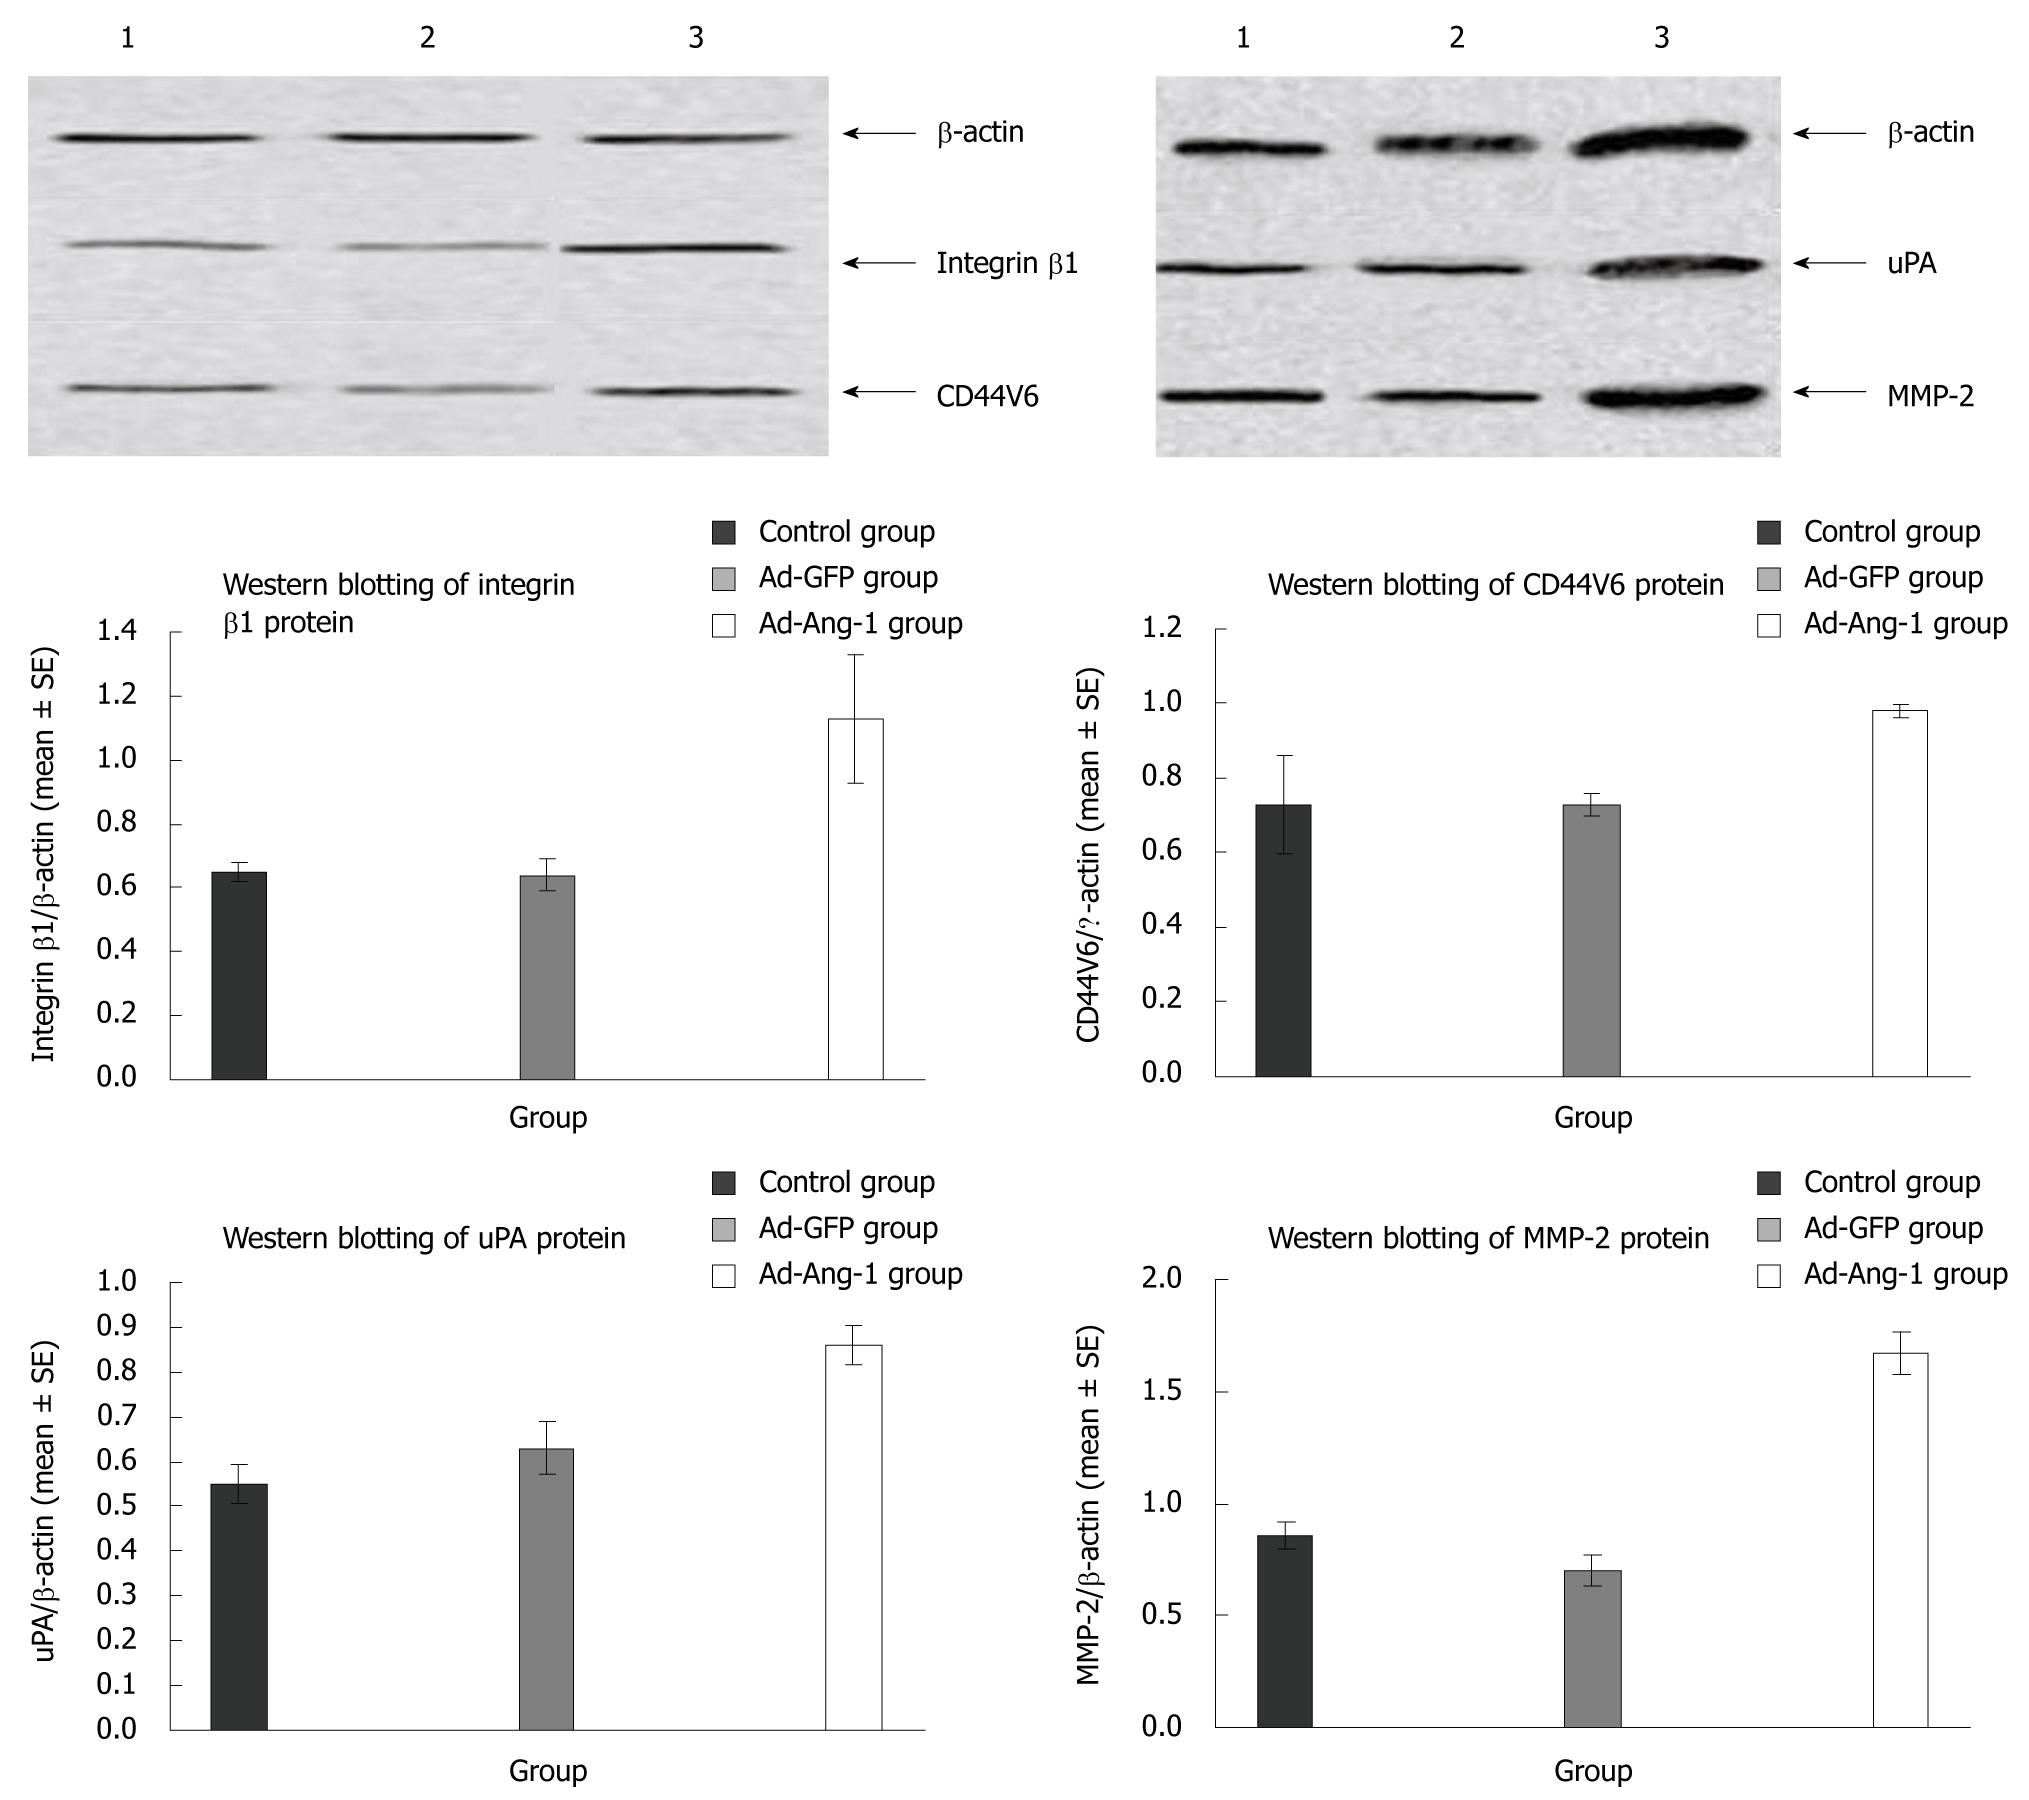
Figure 5 Expression of integrin β1 and CD44V6, uPA and MMP-2 protein.
1: Control group; 2: Ad-GFP-transfected group; 3: Ad-Ang-1-transfected group. After transfection with Ang-1, the protein level was greater than that in the control and Ad-GFP groups, but there was no difference between the control and Ad-GFP group. Diagrams are representive of at least three independent experiments.
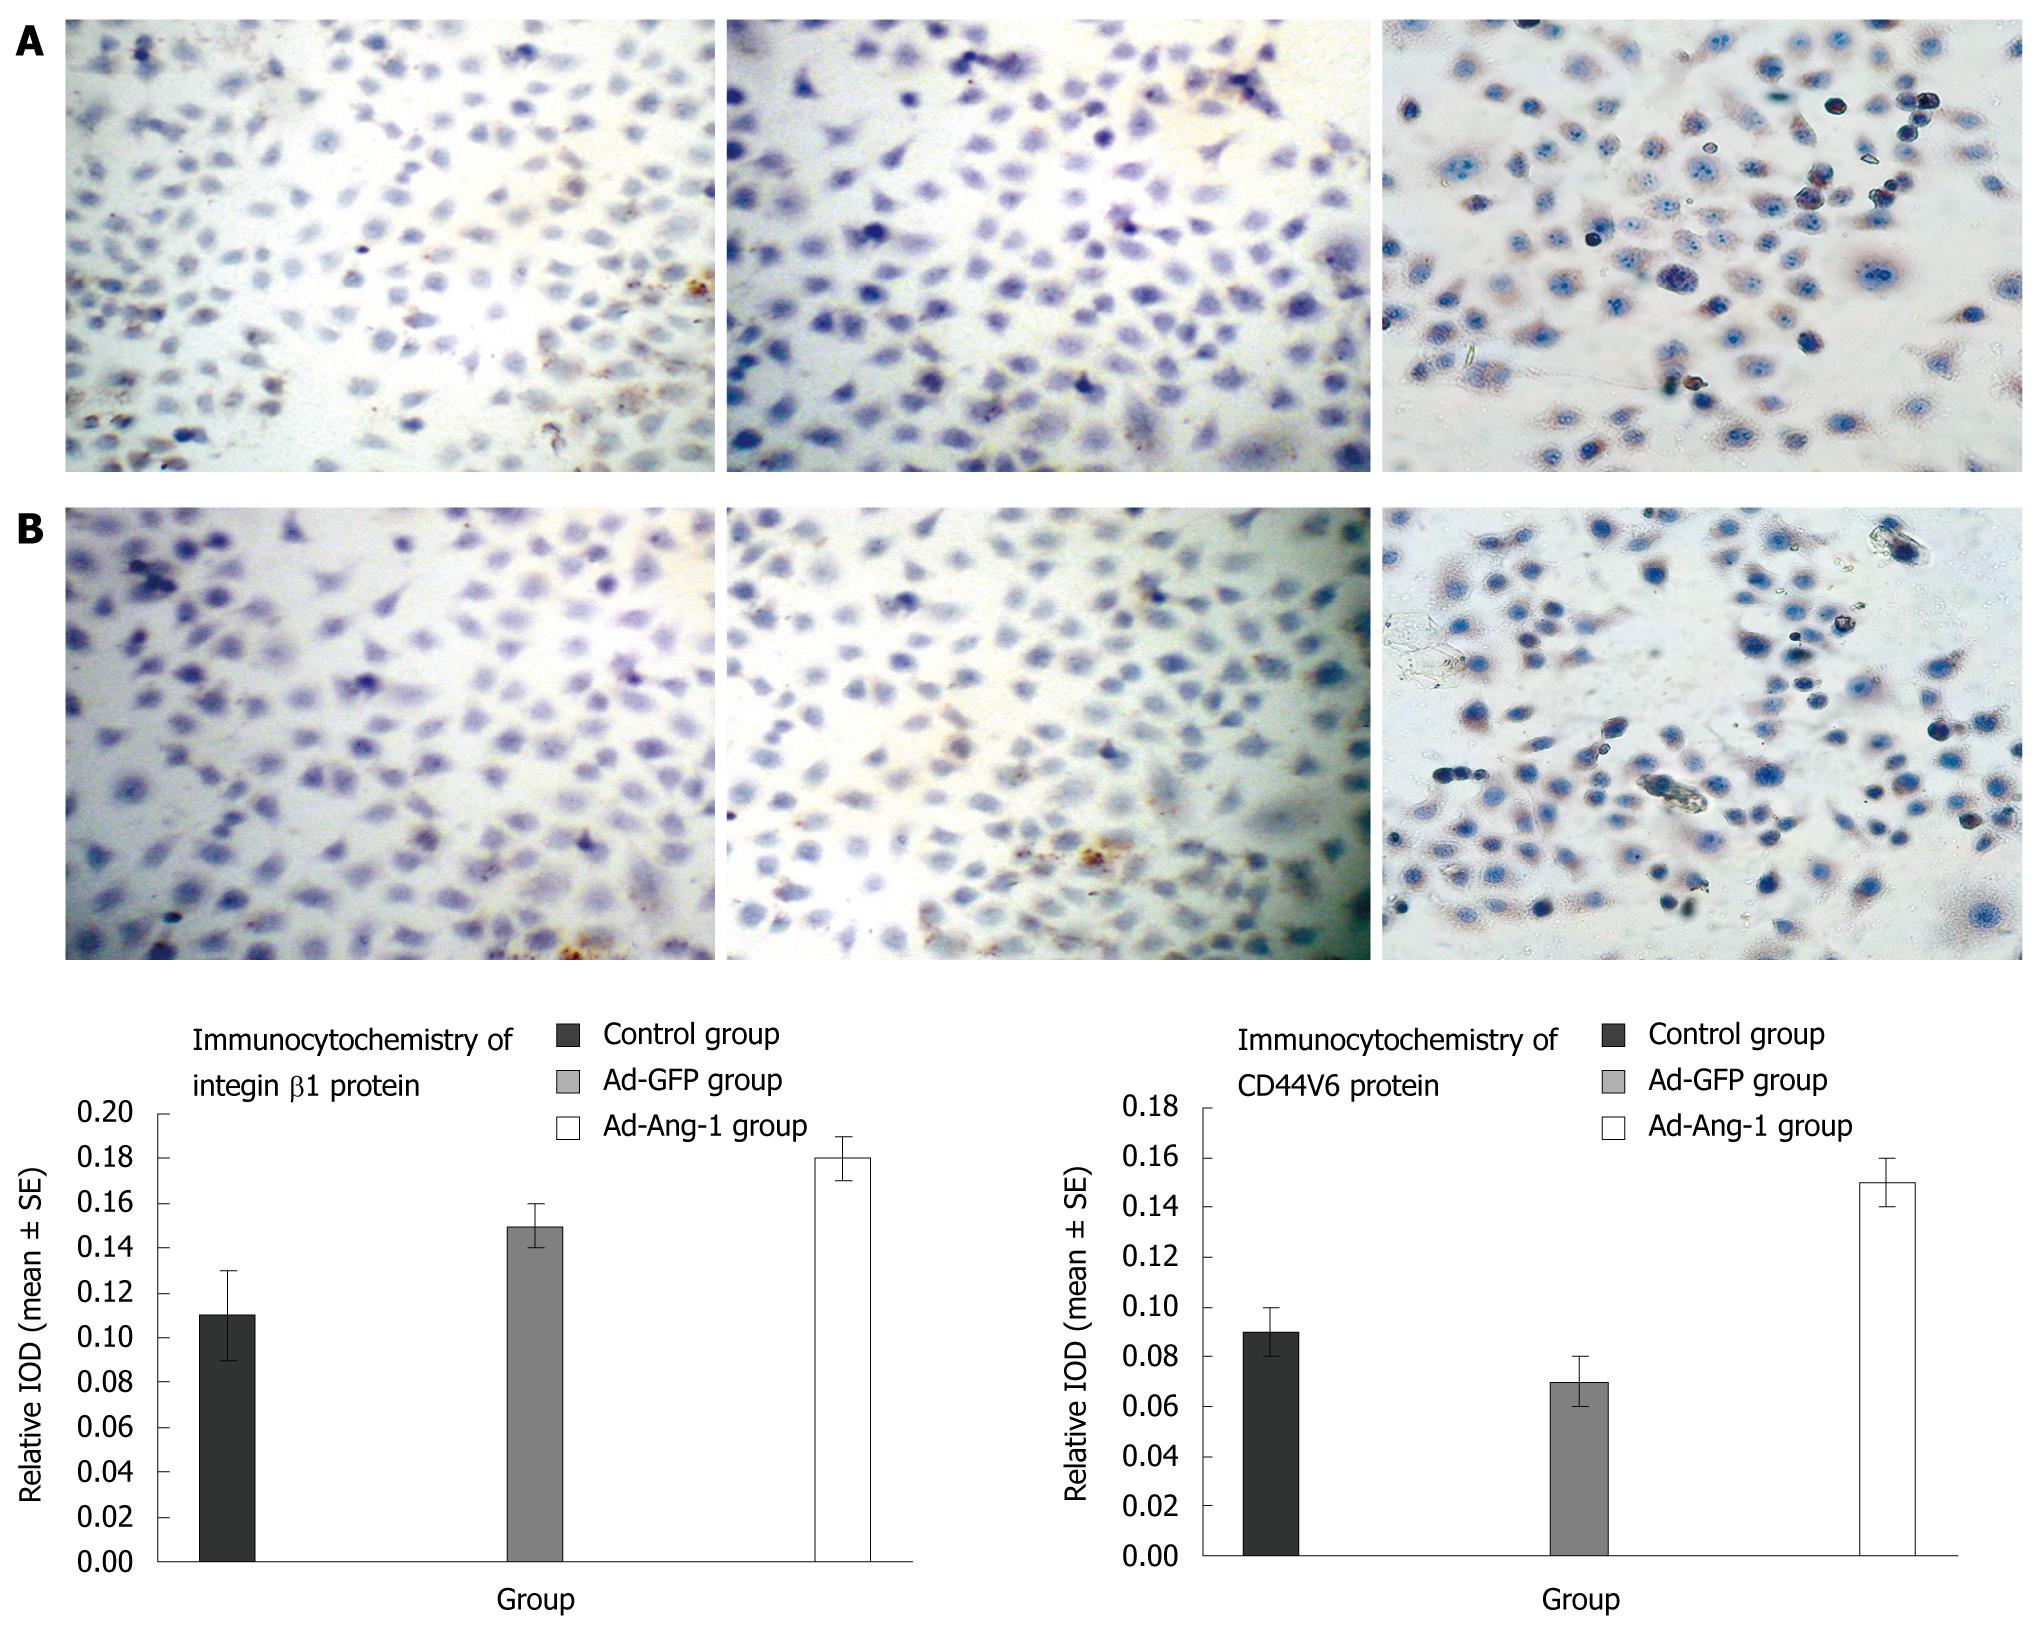
Figure 6 Expression of integrin β1 (A) and CD44V6 (B) protein (× 200).
A: Expression of integrin β1 in the Ad-Ang-1-transfected group was 0.183 ± 0.014, which was significantly higher than that in the control group (0.114 ± 0.023, P < 0.05) and Ad-GFP-transfected group (0.149 ± 0.013, P < 0.05); B: Compared with the other groups, expression of CD44V6 was also up-regulated. The staining intensity for this protein in the Ad-Ang-1-transfected group (0.147 ± 0.011) was higher than that in the control group (0.089 ± 0.007, P < 0.05) and Ad-GFP-transfected group (0.065 ± 0.021, P < 0.05). Diagrams are representive of at least three independent experiments.
- Citation: Ou XL, Chen HJ, Sun WH, Hang C, Yang L, Guan YY, Yan F, Chen BA. Effects of angiopoietin-1 on attachment and metastasis of human gastric cancer cell line BGC-823. World J Gastroenterol 2009; 15(43): 5432-5441
- URL: https://www.wjgnet.com/1007-9327/full/v15/i43/5432.htm
- DOI: https://dx.doi.org/10.3748/wjg.15.5432


