Copyright
©2009 The WJG Press and Baishideng.
World J Gastroenterol. Sep 28, 2009; 15(36): 4511-4517
Published online Sep 28, 2009. doi: 10.3748/wjg.15.4511
Published online Sep 28, 2009. doi: 10.3748/wjg.15.4511
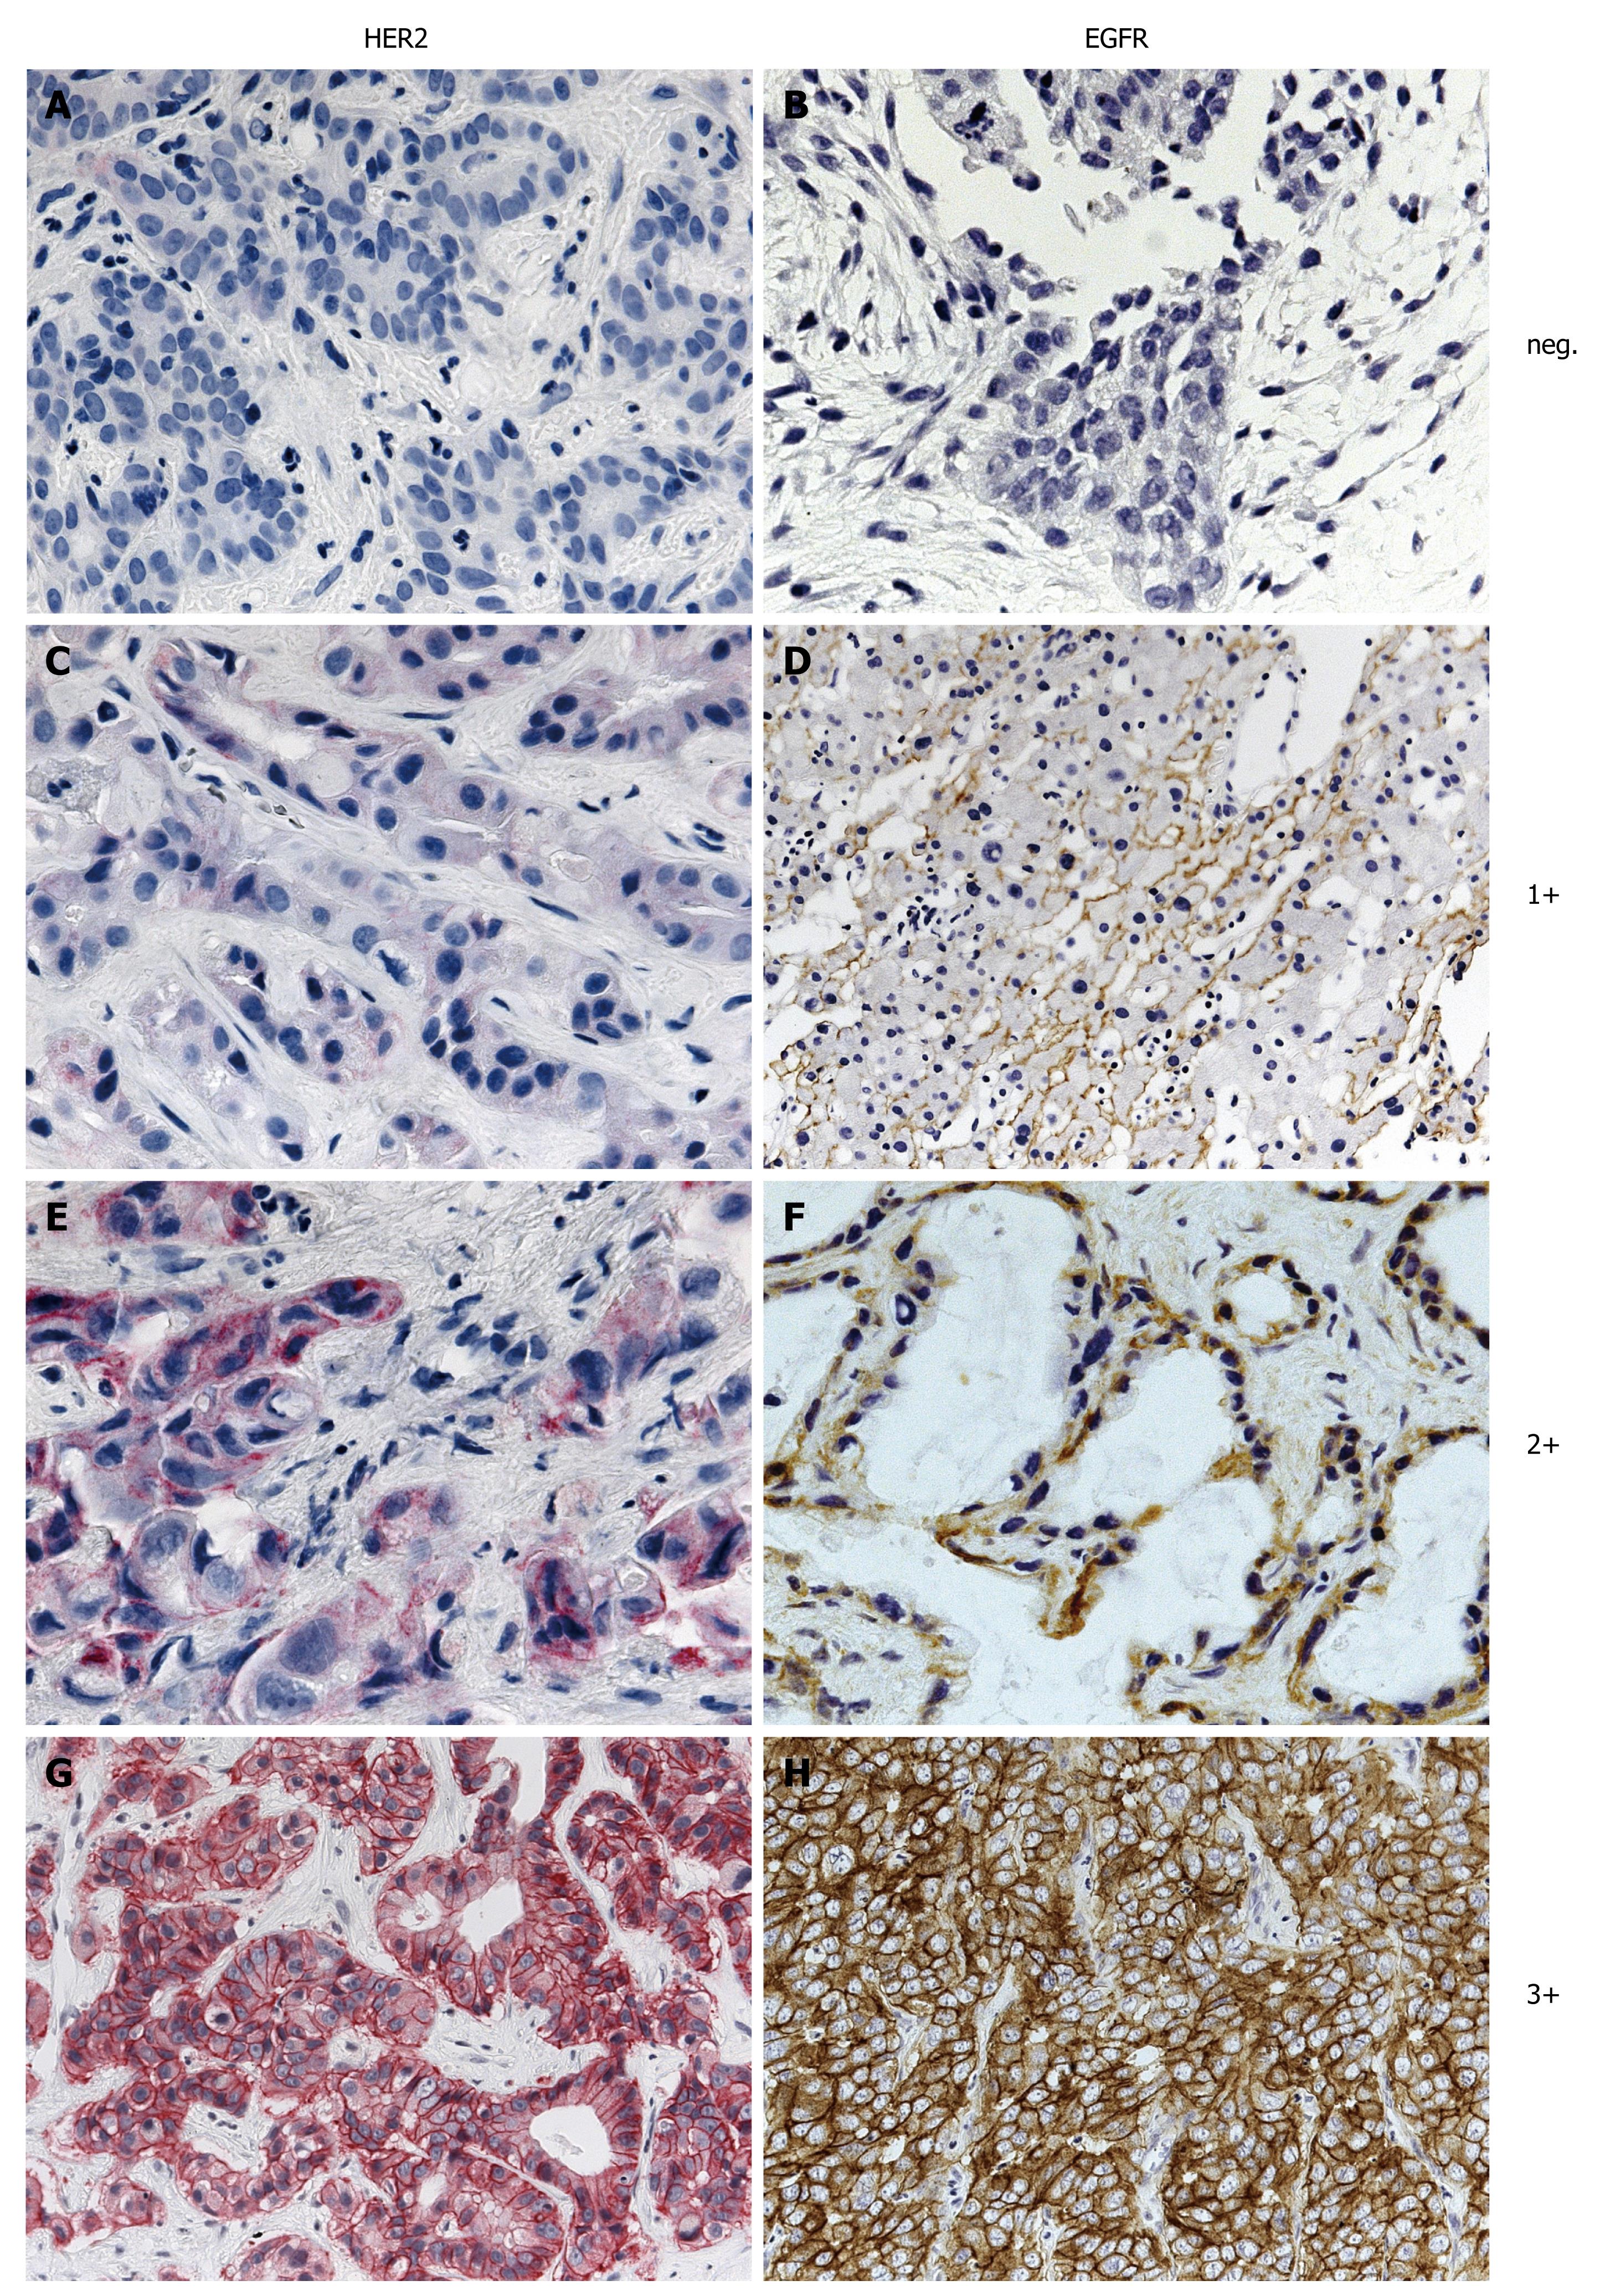
Figure 1 Immunohistochemistry of biliary tract cancer specimens for expression of HER2 (A, C, E and G) and EGFR (B, D, F and H).
A: HER2 neg.; B: EGFR neg.; C: HER2 1+; D: EGFR 1+; E: HER2 2+; F: EGFR 2+; G: HER2 3+; H: EGFR 3+.
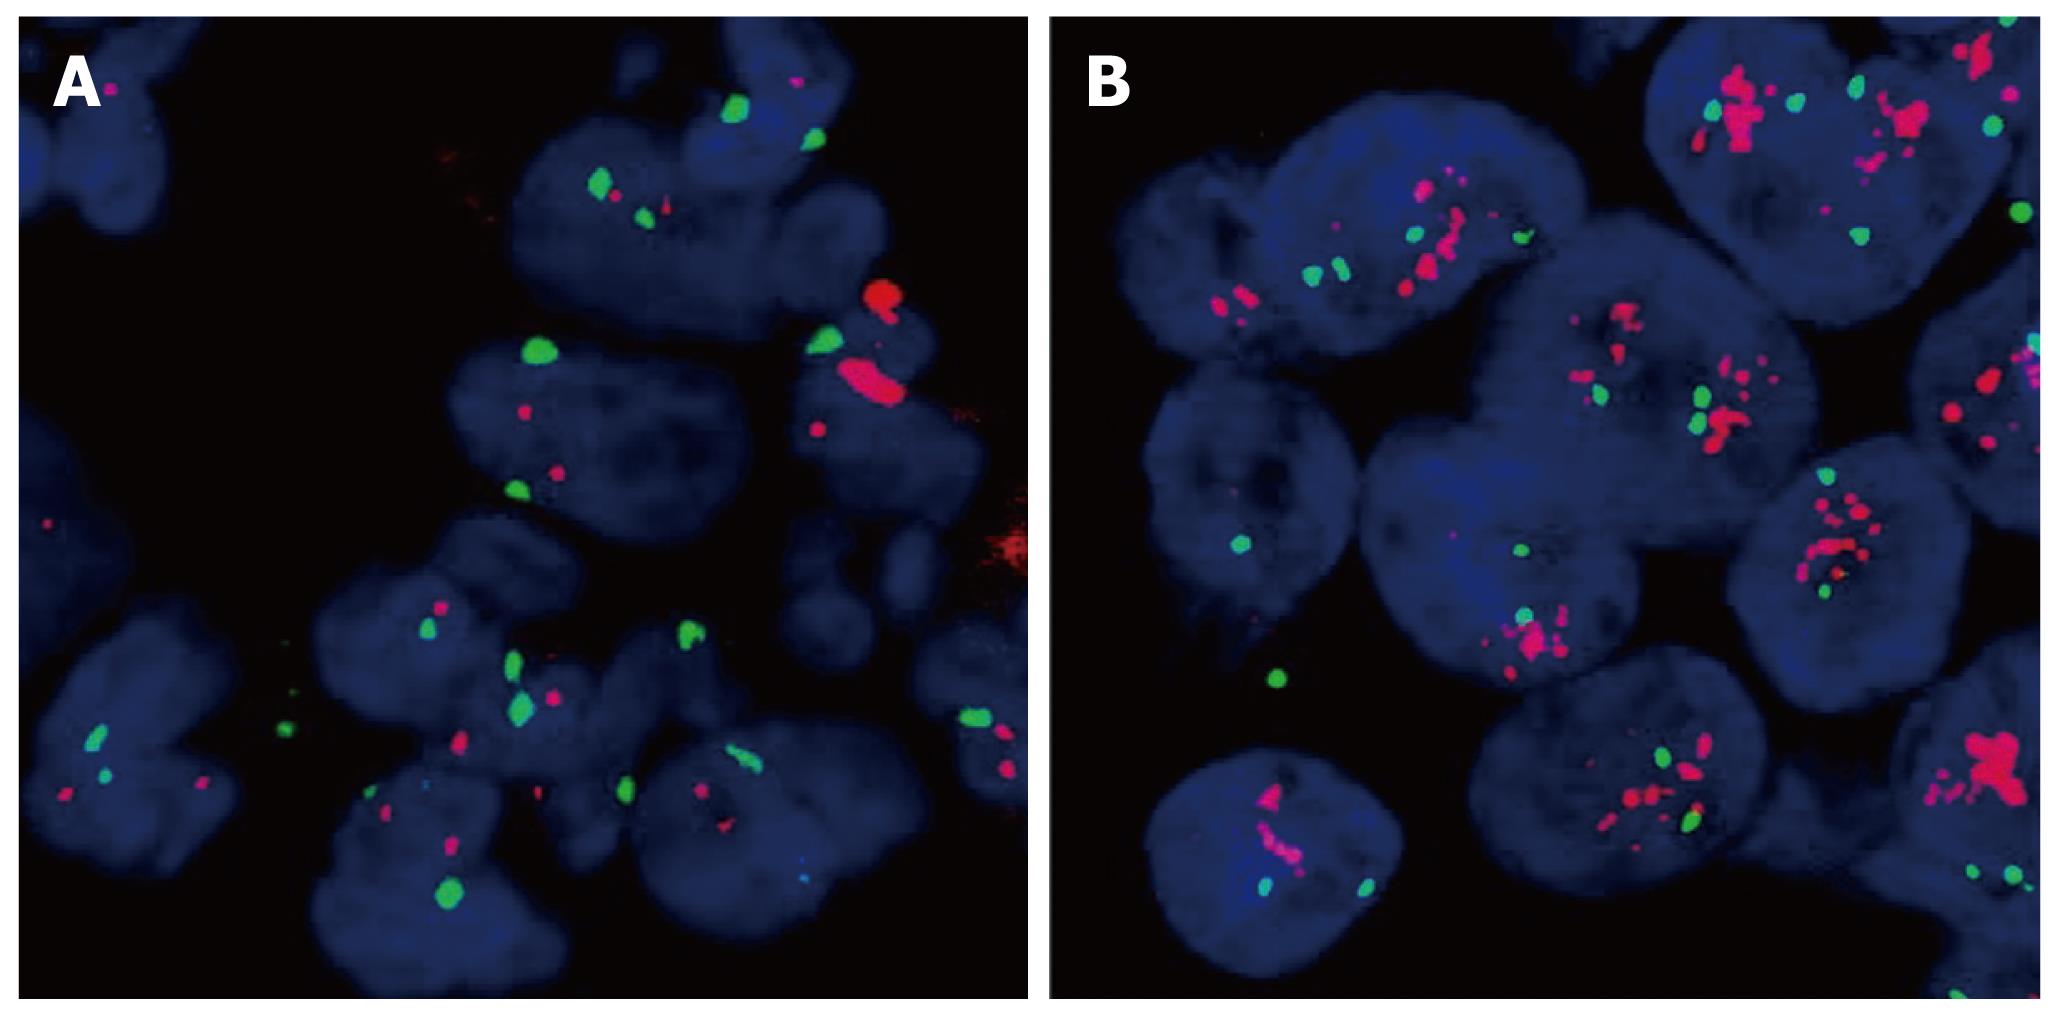
Figure 2 Dual color FISH analysis of HER2 in cholangiocarcinoma specimens.
A: Nonamplified tumor with single HER2 gene copy status. The red probe is specific for HER2. The green probe is specific for chromosome 17 centromere; B: Tumor with high amplification of the HER2 gene. There are multiple red HER2 specific signals in this tumor in relation to the green chromosome 17 signals.
- Citation: Harder J, Waiz O, Otto F, Geissler M, Olschewski M, Weinhold B, Blum HE, Schmitt-Graeff A, Opitz OG. EGFR and HER2 expression in advanced biliary tract cancer. World J Gastroenterol 2009; 15(36): 4511-4517
- URL: https://www.wjgnet.com/1007-9327/full/v15/i36/4511.htm
- DOI: https://dx.doi.org/10.3748/wjg.15.4511


