Copyright
©2009 The WJG Press and Baishideng.
World J Gastroenterol. Jul 28, 2009; 15(28): 3532-3537
Published online Jul 28, 2009. doi: 10.3748/wjg.15.3532
Published online Jul 28, 2009. doi: 10.3748/wjg.15.3532
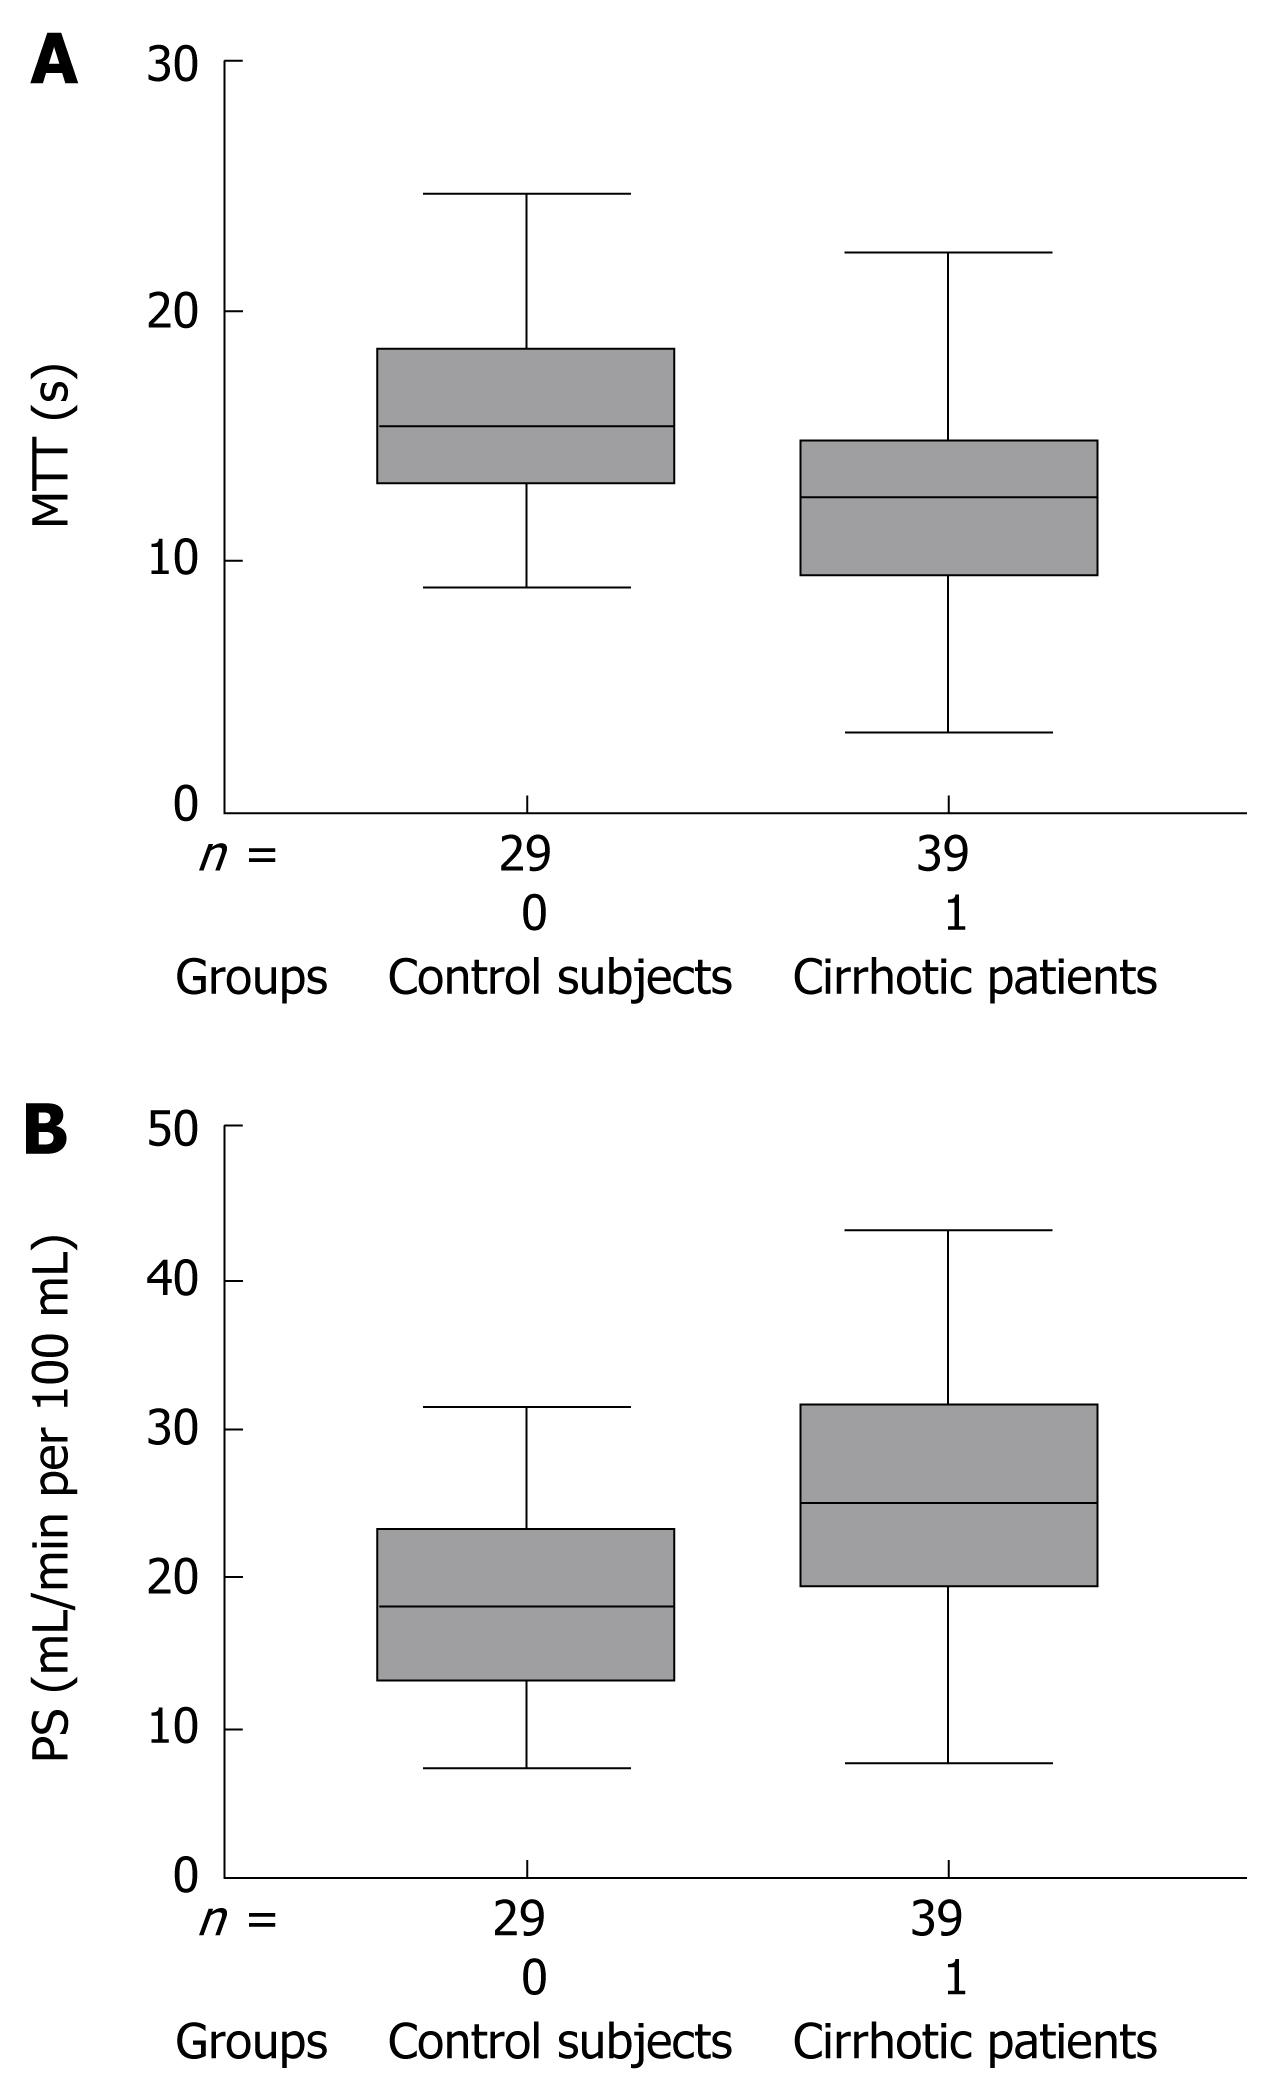
Figure 1 Distribution of hepatic microvascular parameters in controls and cirrhotics.
Box-whisker plots are shown, in which the lower box boundary indicates the 25th percentile, the line within the box marks the median and the top box boundary indicates the 75th percentile. Error bars below and above the boxes indicate 10th and 90th percentiles. Other data are represented as individual dots. The graphs show box-whisker plots of mean transit time (MTT) (A) and permeability surface area product (PS) (B). n: Number of patients.
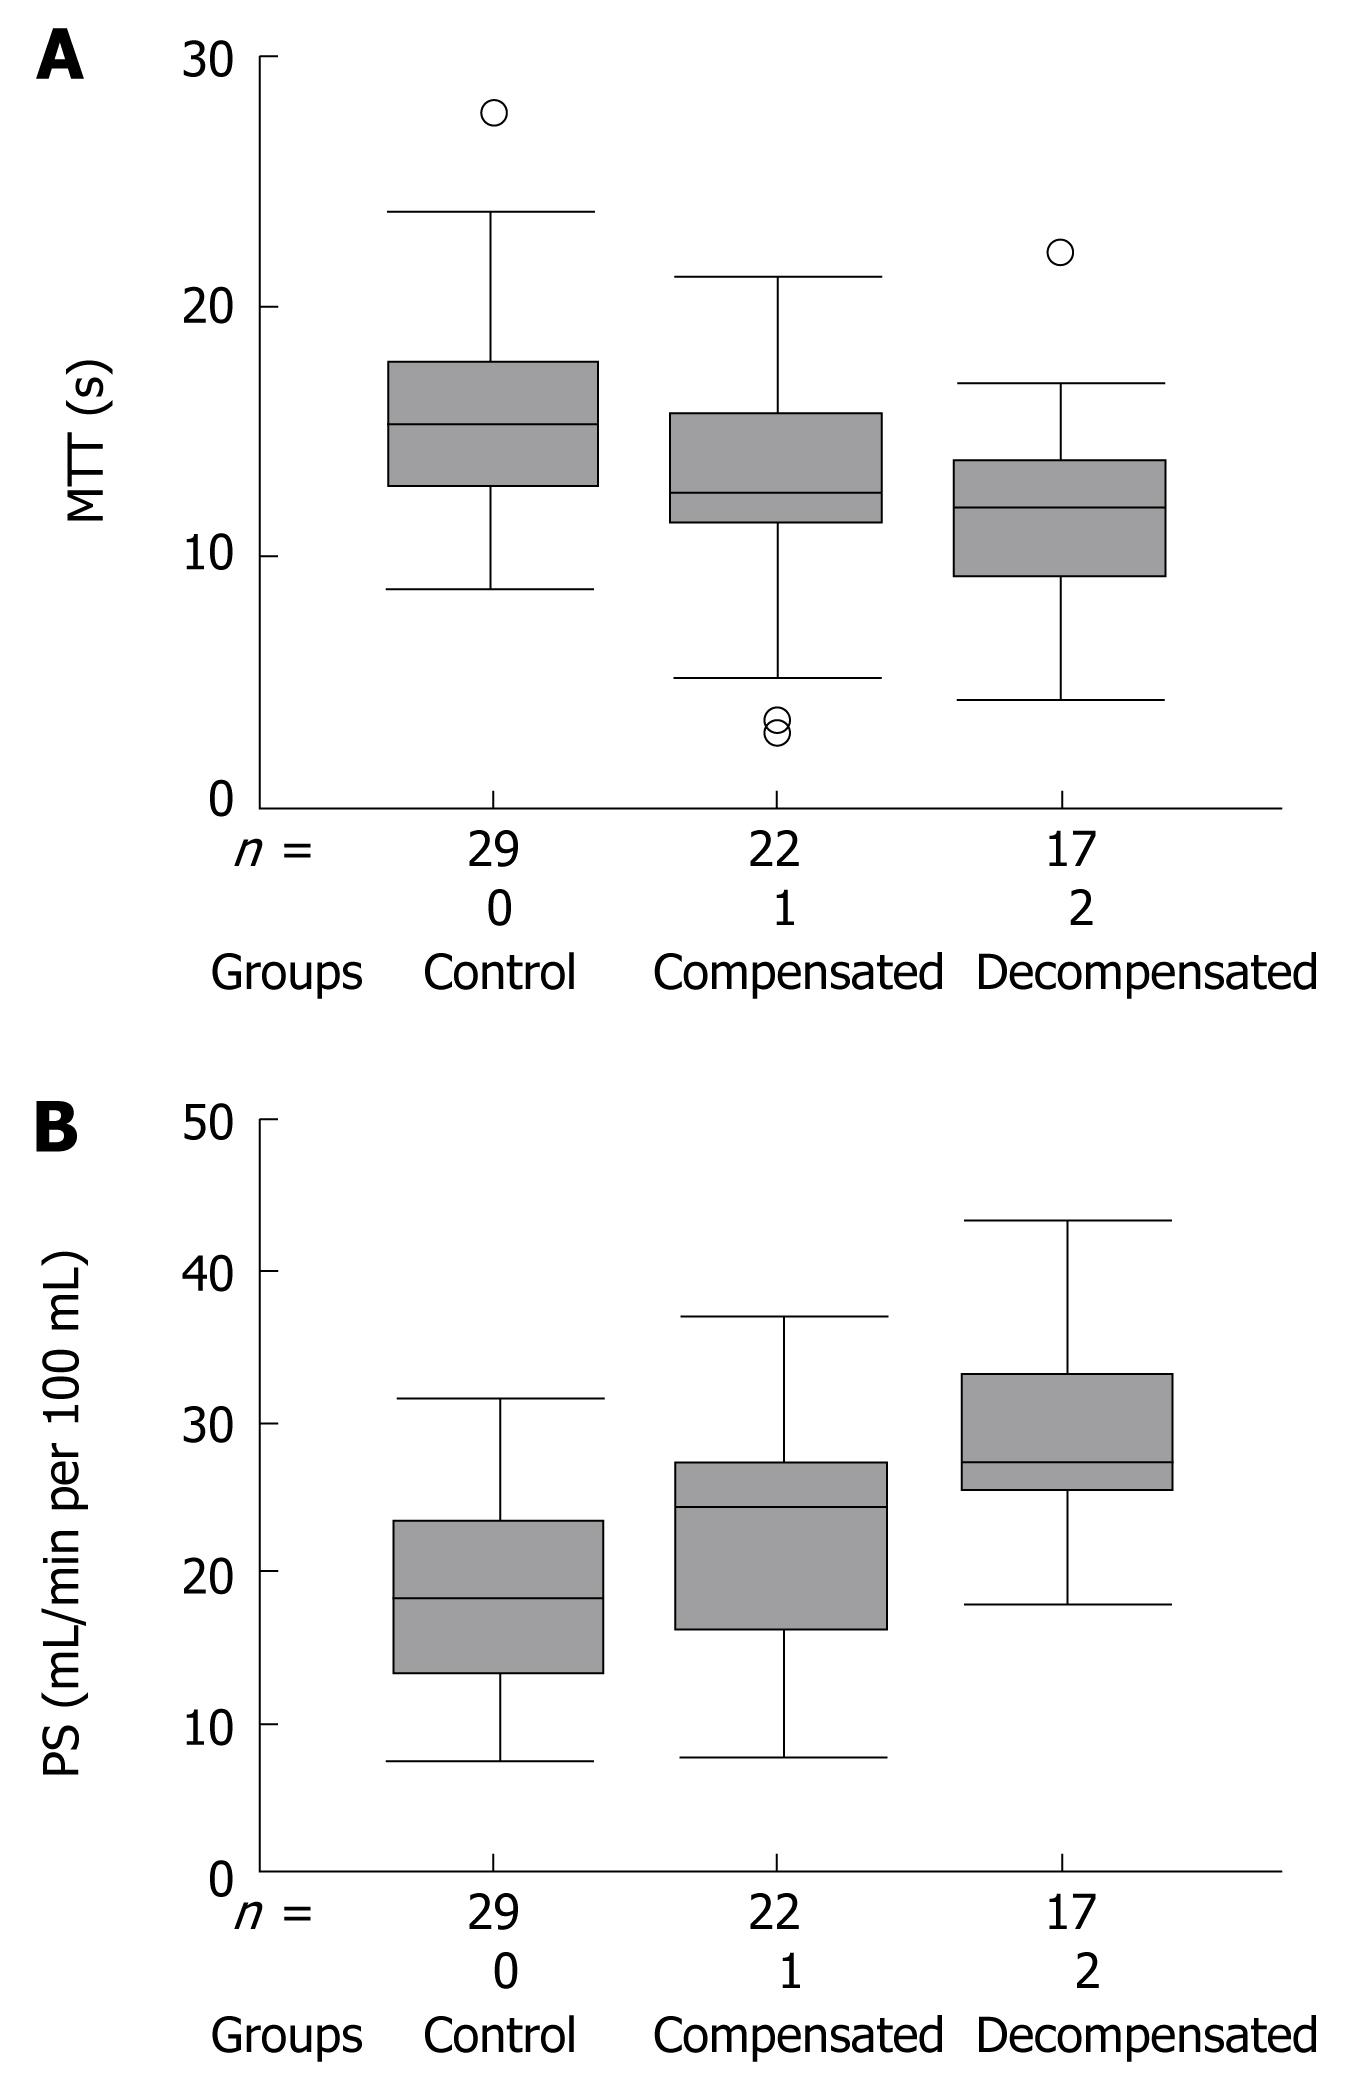
Figure 2 The box-whisker plots show the distribution of hepatic microvacular parameters in controls as well as in compensated and decompensated cirrhosis patients.
The values of MTT (A) and PS (B) are shown.
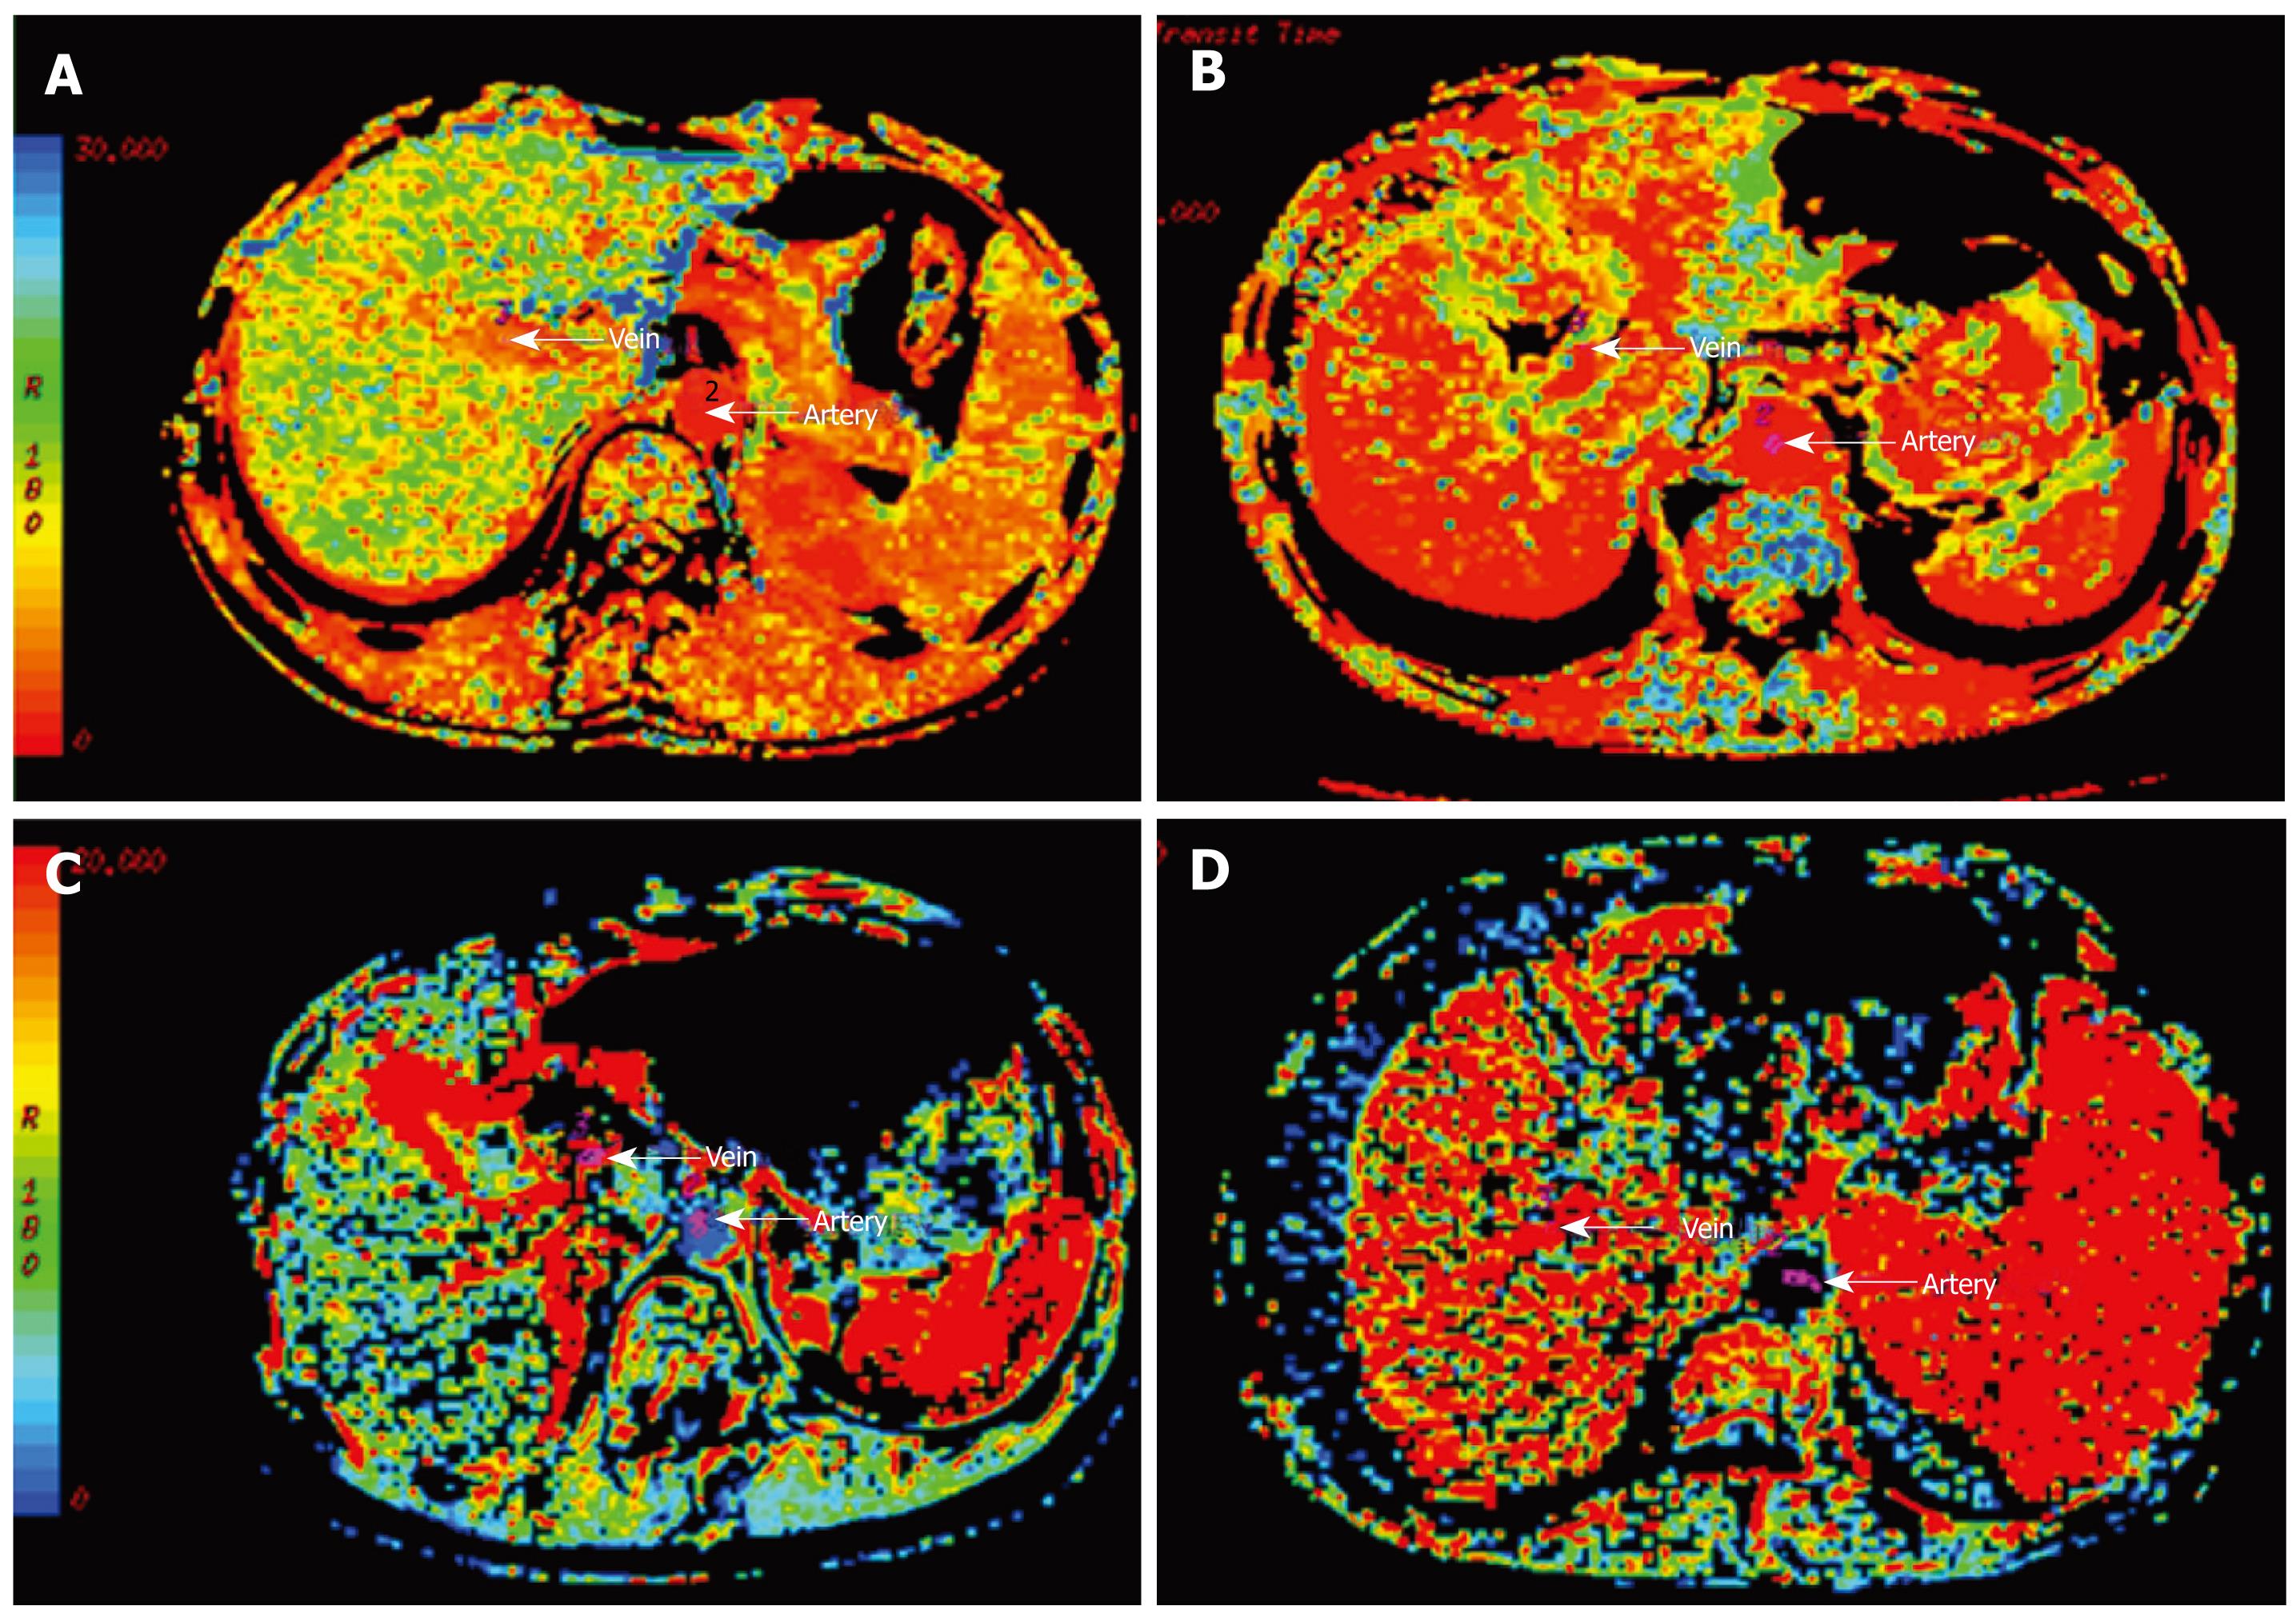
Figure 3 MTT and PS maps between controls and cirrhotic patients.
MTT in a control subject (A) was higher than in a cirrhotic patient (B). PS in a control subject (C) was lower than in a cirrhotic patient (D).
- Citation: Chen ML, Zeng QY, Huo JW, Yin XM, Li BP, Liu JX. Assessment of the hepatic microvascular changes in liver cirrhosis by perfusion computed tomography. World J Gastroenterol 2009; 15(28): 3532-3537
- URL: https://www.wjgnet.com/1007-9327/full/v15/i28/3532.htm
- DOI: https://dx.doi.org/10.3748/wjg.15.3532


