Copyright
©2009 The WJG Press and Baishideng.
World J Gastroenterol. Jul 28, 2009; 15(28): 3480-3485
Published online Jul 28, 2009. doi: 10.3748/wjg.15.3480
Published online Jul 28, 2009. doi: 10.3748/wjg.15.3480
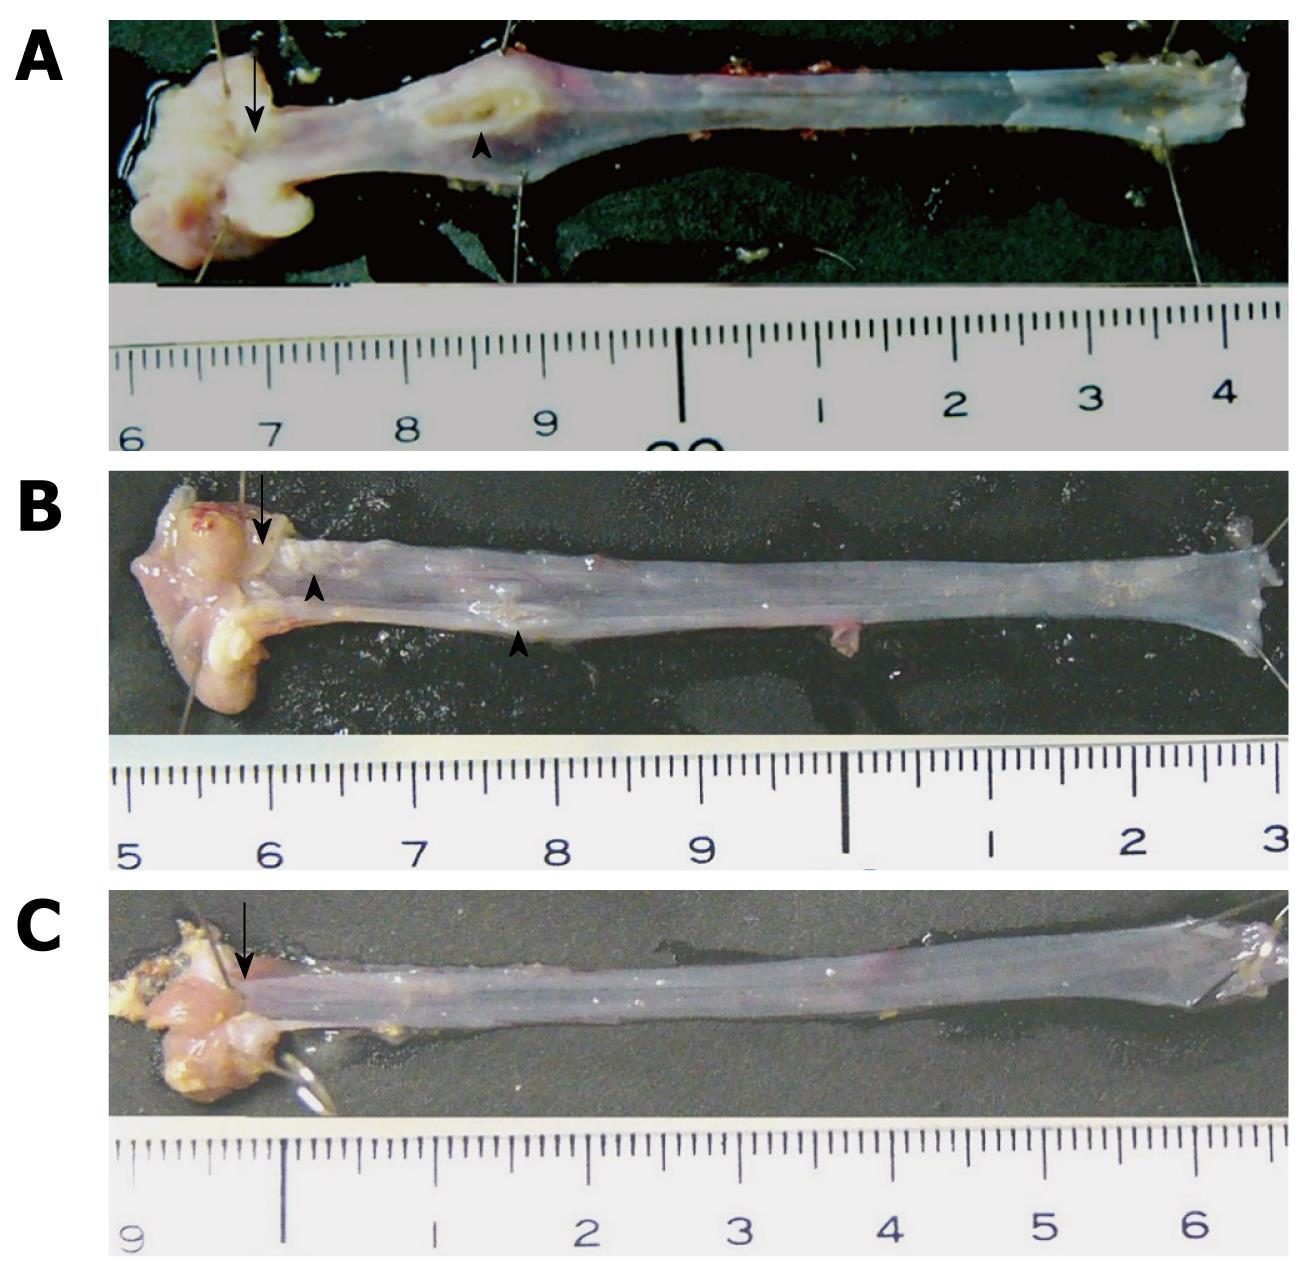
Figure 1 Macroscopic findings in the three groups.
A: Esophagitis group on day 7 after operation; B: ES group on day 7 after operation; C: Control group on day 7 after operation. In the esophagitis and ES groups, ulcers were noted in the mucosa, but none occurred in the control group. The arrows indicate the EG junction. The arrowheads indicate ulcers.
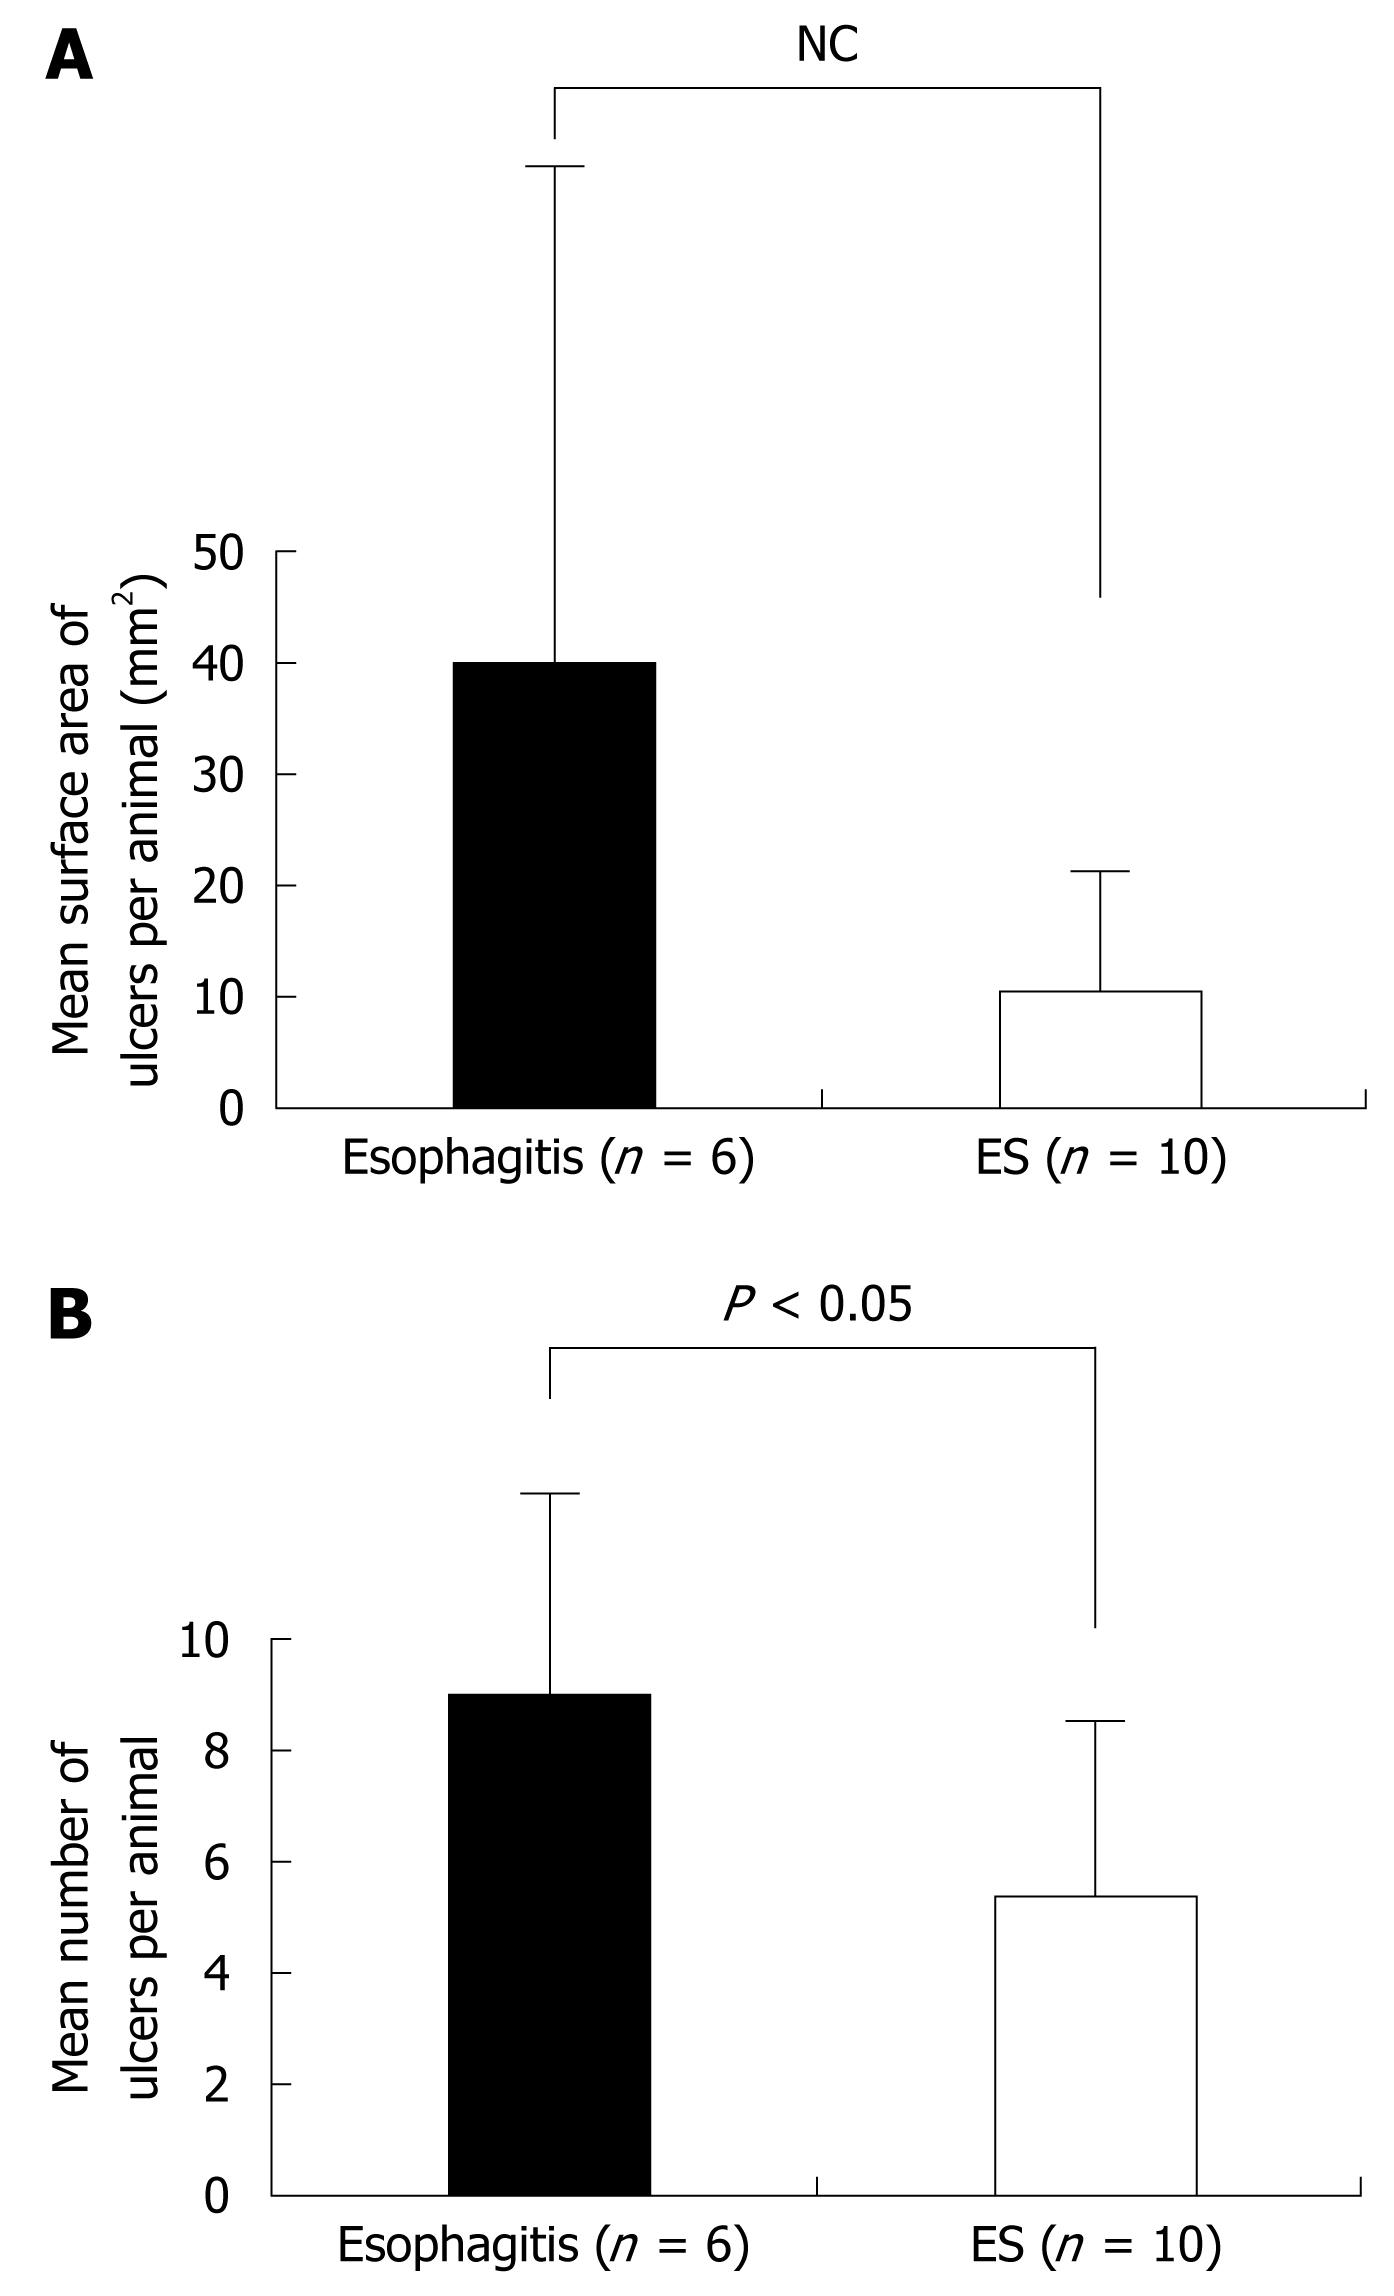
Figure 2 Mean surface area and number of ulcers per animal.
A: Mean surface area of ulcers per animal in the esophagitis and ES groups. There were no significant differences in the mean area of ulcers between the two groups; B: Mean number of ulcers per animal in the esophagitis and ES groups. In the ES group, the number of ulcers was significantly less than in the esophagitis group (5.4 ± 2.5 vs 9.0 ± 3.5, P < 0.05).
Figure 3 Mean surface area and number of ulcers in each of the three individual segments of the esophagus.
A: Mean surface area of ulcers in each part of the esophagus in the esophagitis and ES groups; B: Mean number of ulcers in each part of the esophagus in the esophagitis and ES groups. There were no significant between-group differences in terms of the number and mean area of ulcers in each of the three individual segments of the esophagus.
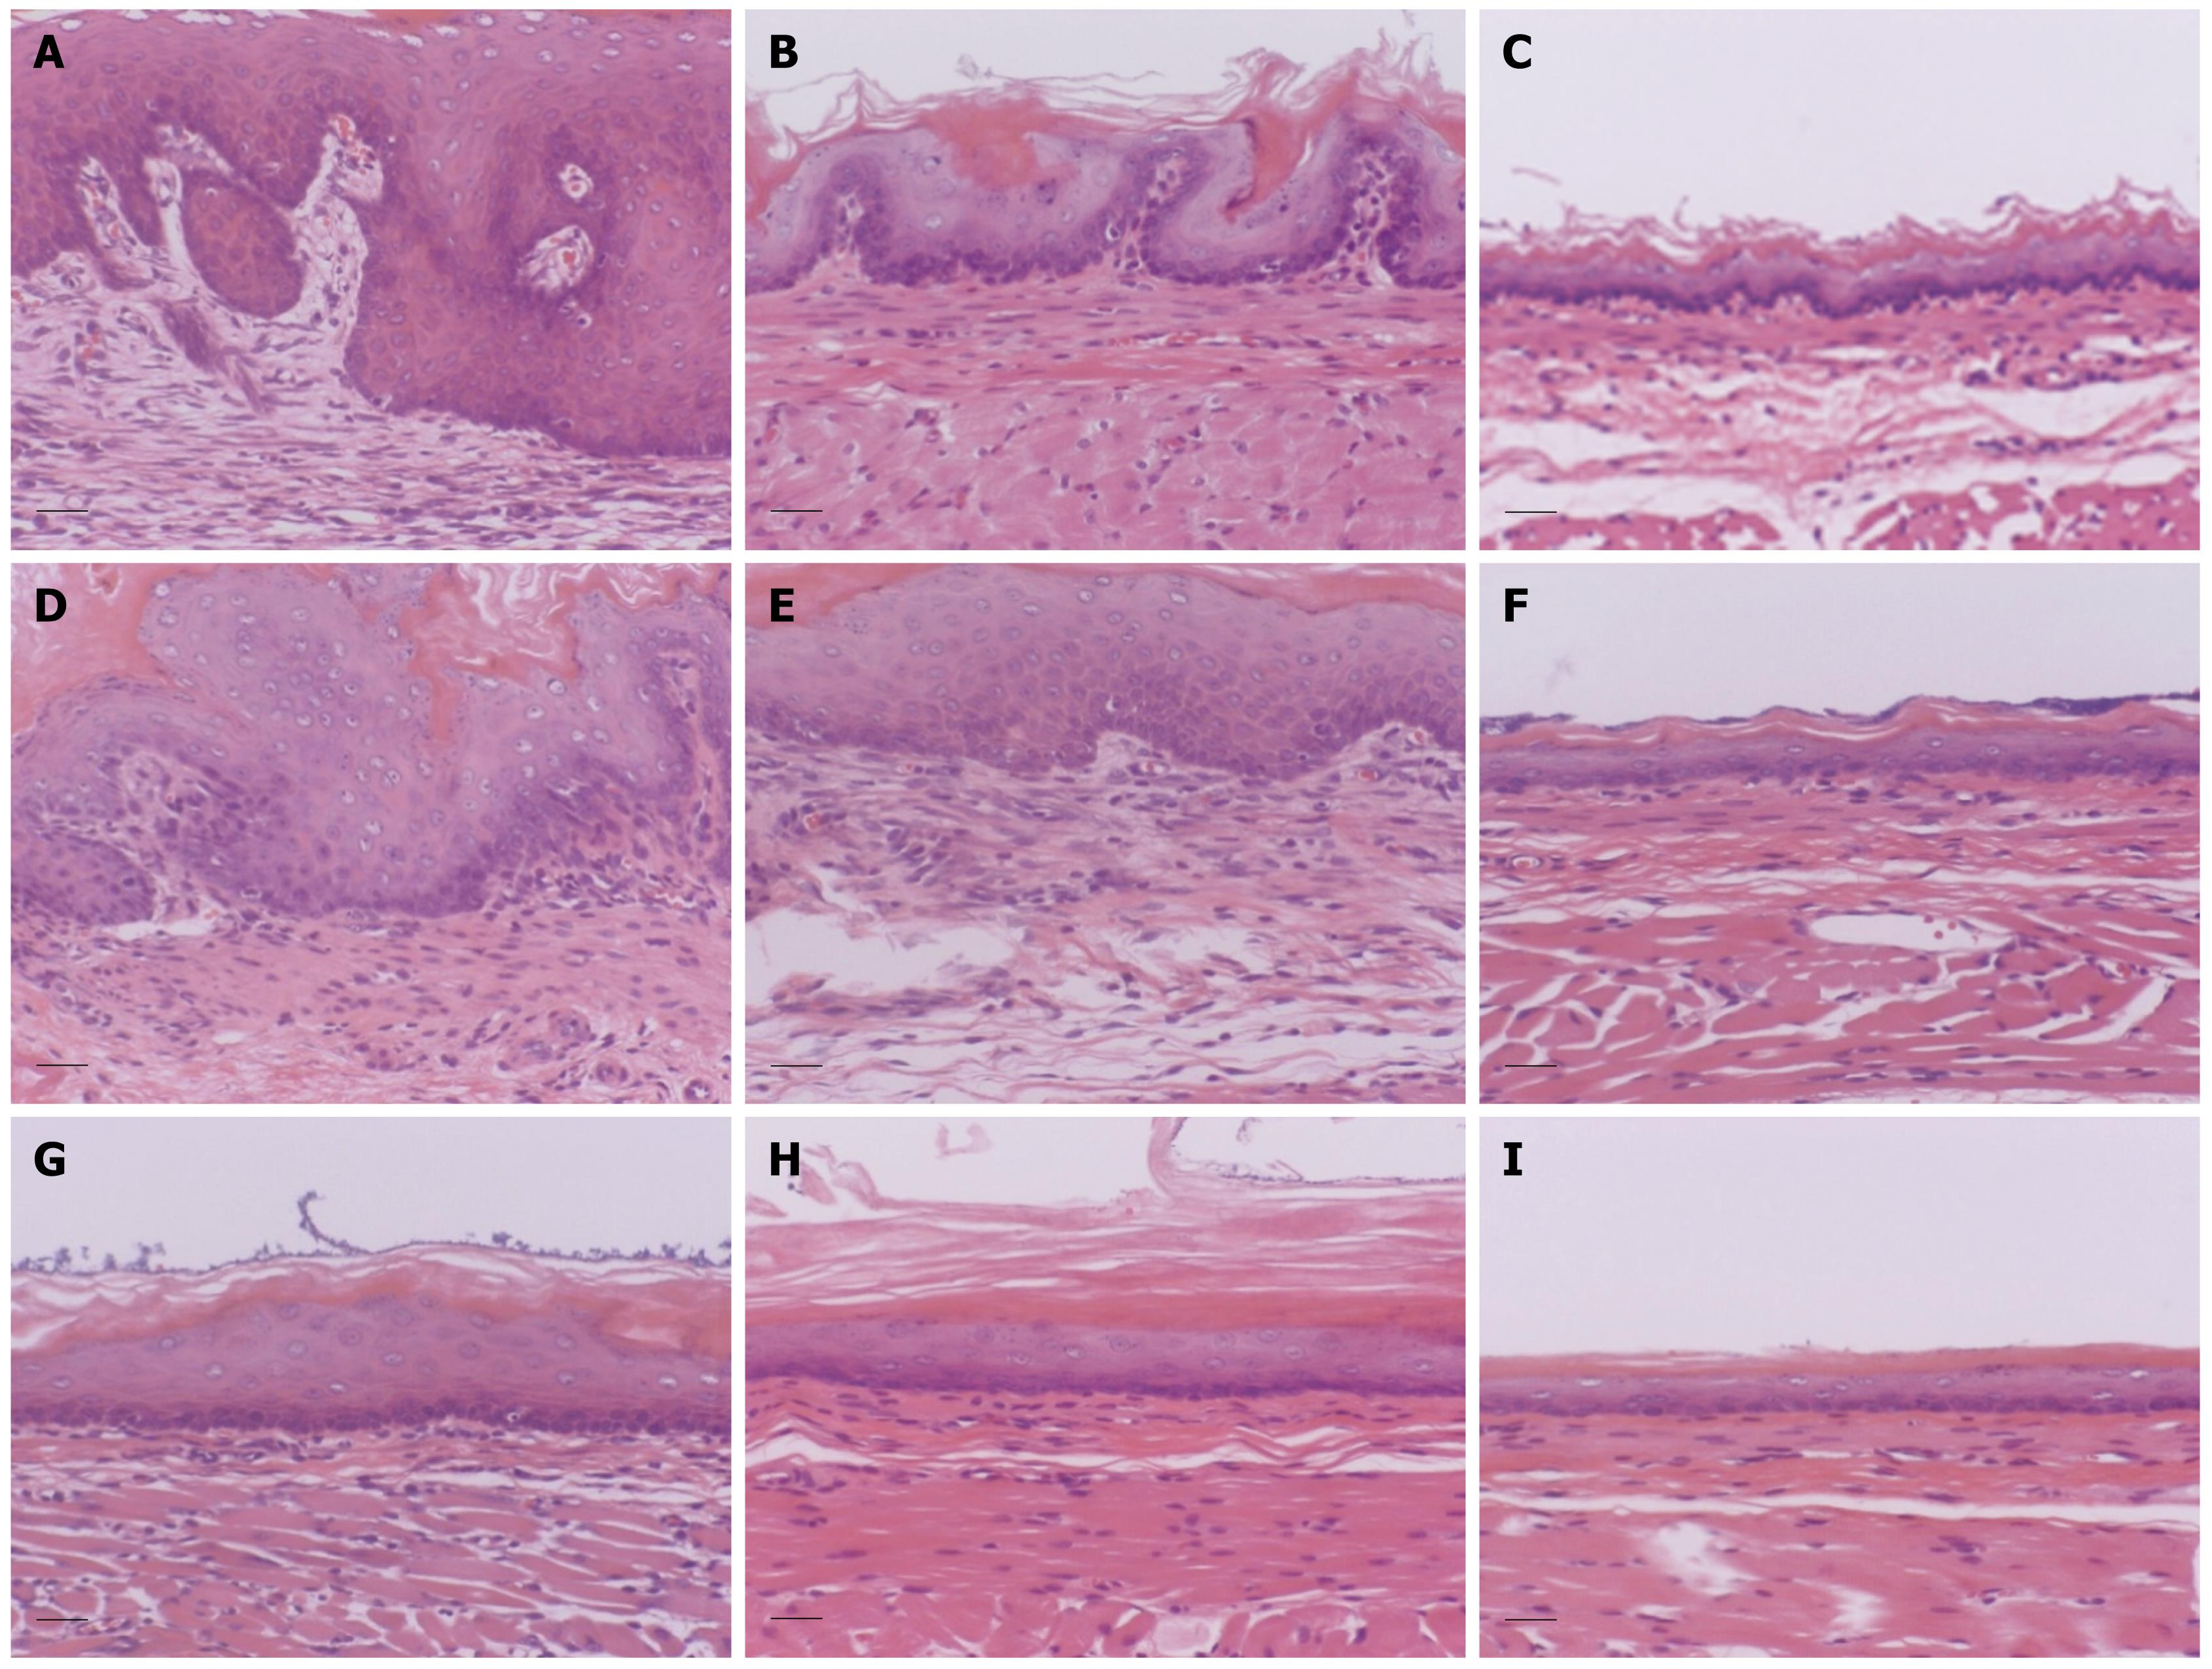
Figure 4 Histological findings in each part of the esophagus in the three groups (HE staining).
Lower esophagus: esophagitis (A), ES (B) and control (C) groups. Middle esophagus: esophagitis (D), ES (E) and control (F) groups. Upper esophagus: esophagitis (G), ES (H) and control (I) groups. In the ES group, the thickness of the epithelium in the lower esophagus was significantly decreased compared with that in the esophagitis group. Scale bar, 30 &mgr;m.
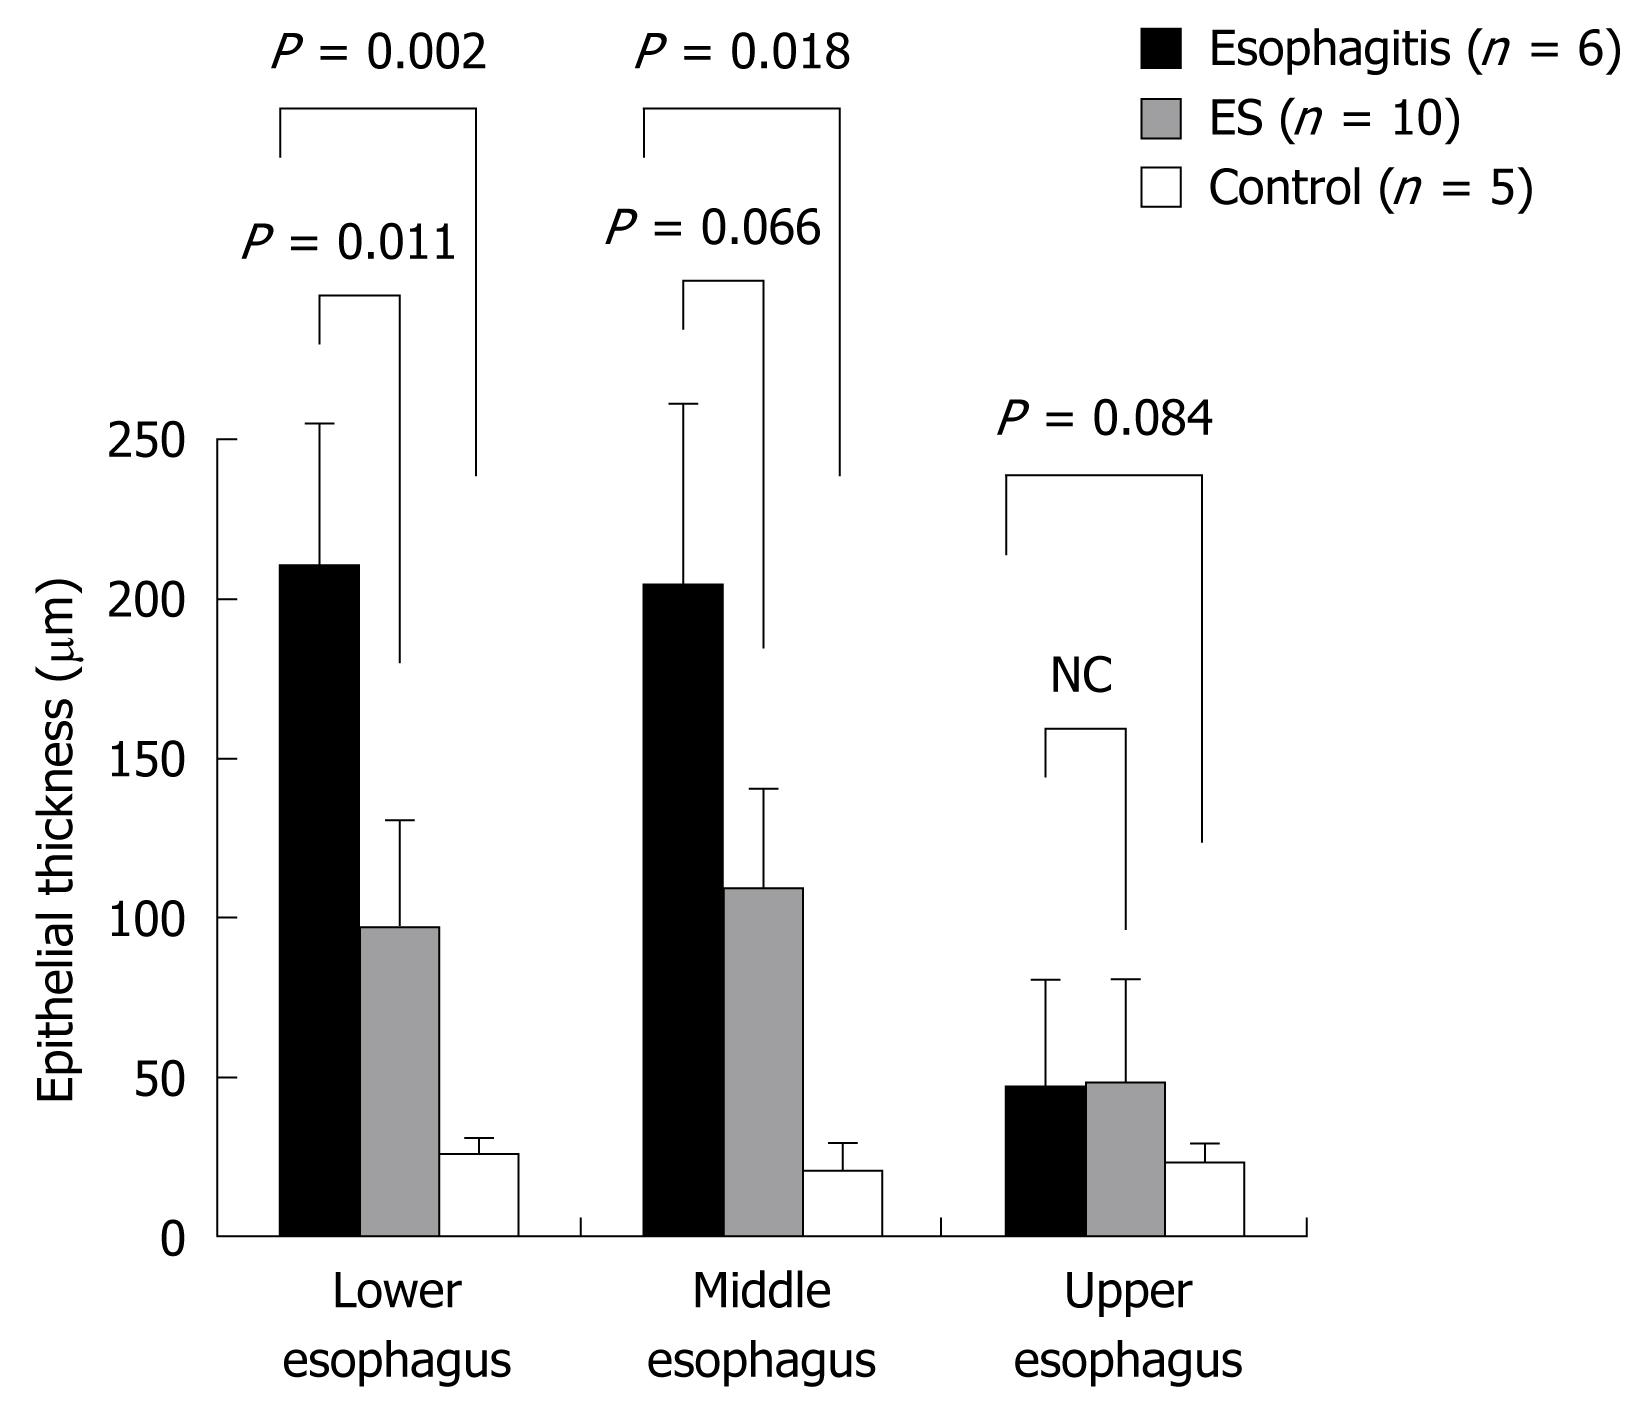
Figure 5 Thickness of the esophageal epithelium in the three groups.
In the esophagitis group, the thickness of the epithelium in the lower and middle esophagus was significantly greater than that in the controls (P < 0.05). In the ES group, the thickness of the epithelium in the lower esophagus was significantly less than that in the esophagitis group (P < 0.05), and the thickness of the epithelium in the middle esophagus tended to be less than that in the esophagitis group (P = 0.066).
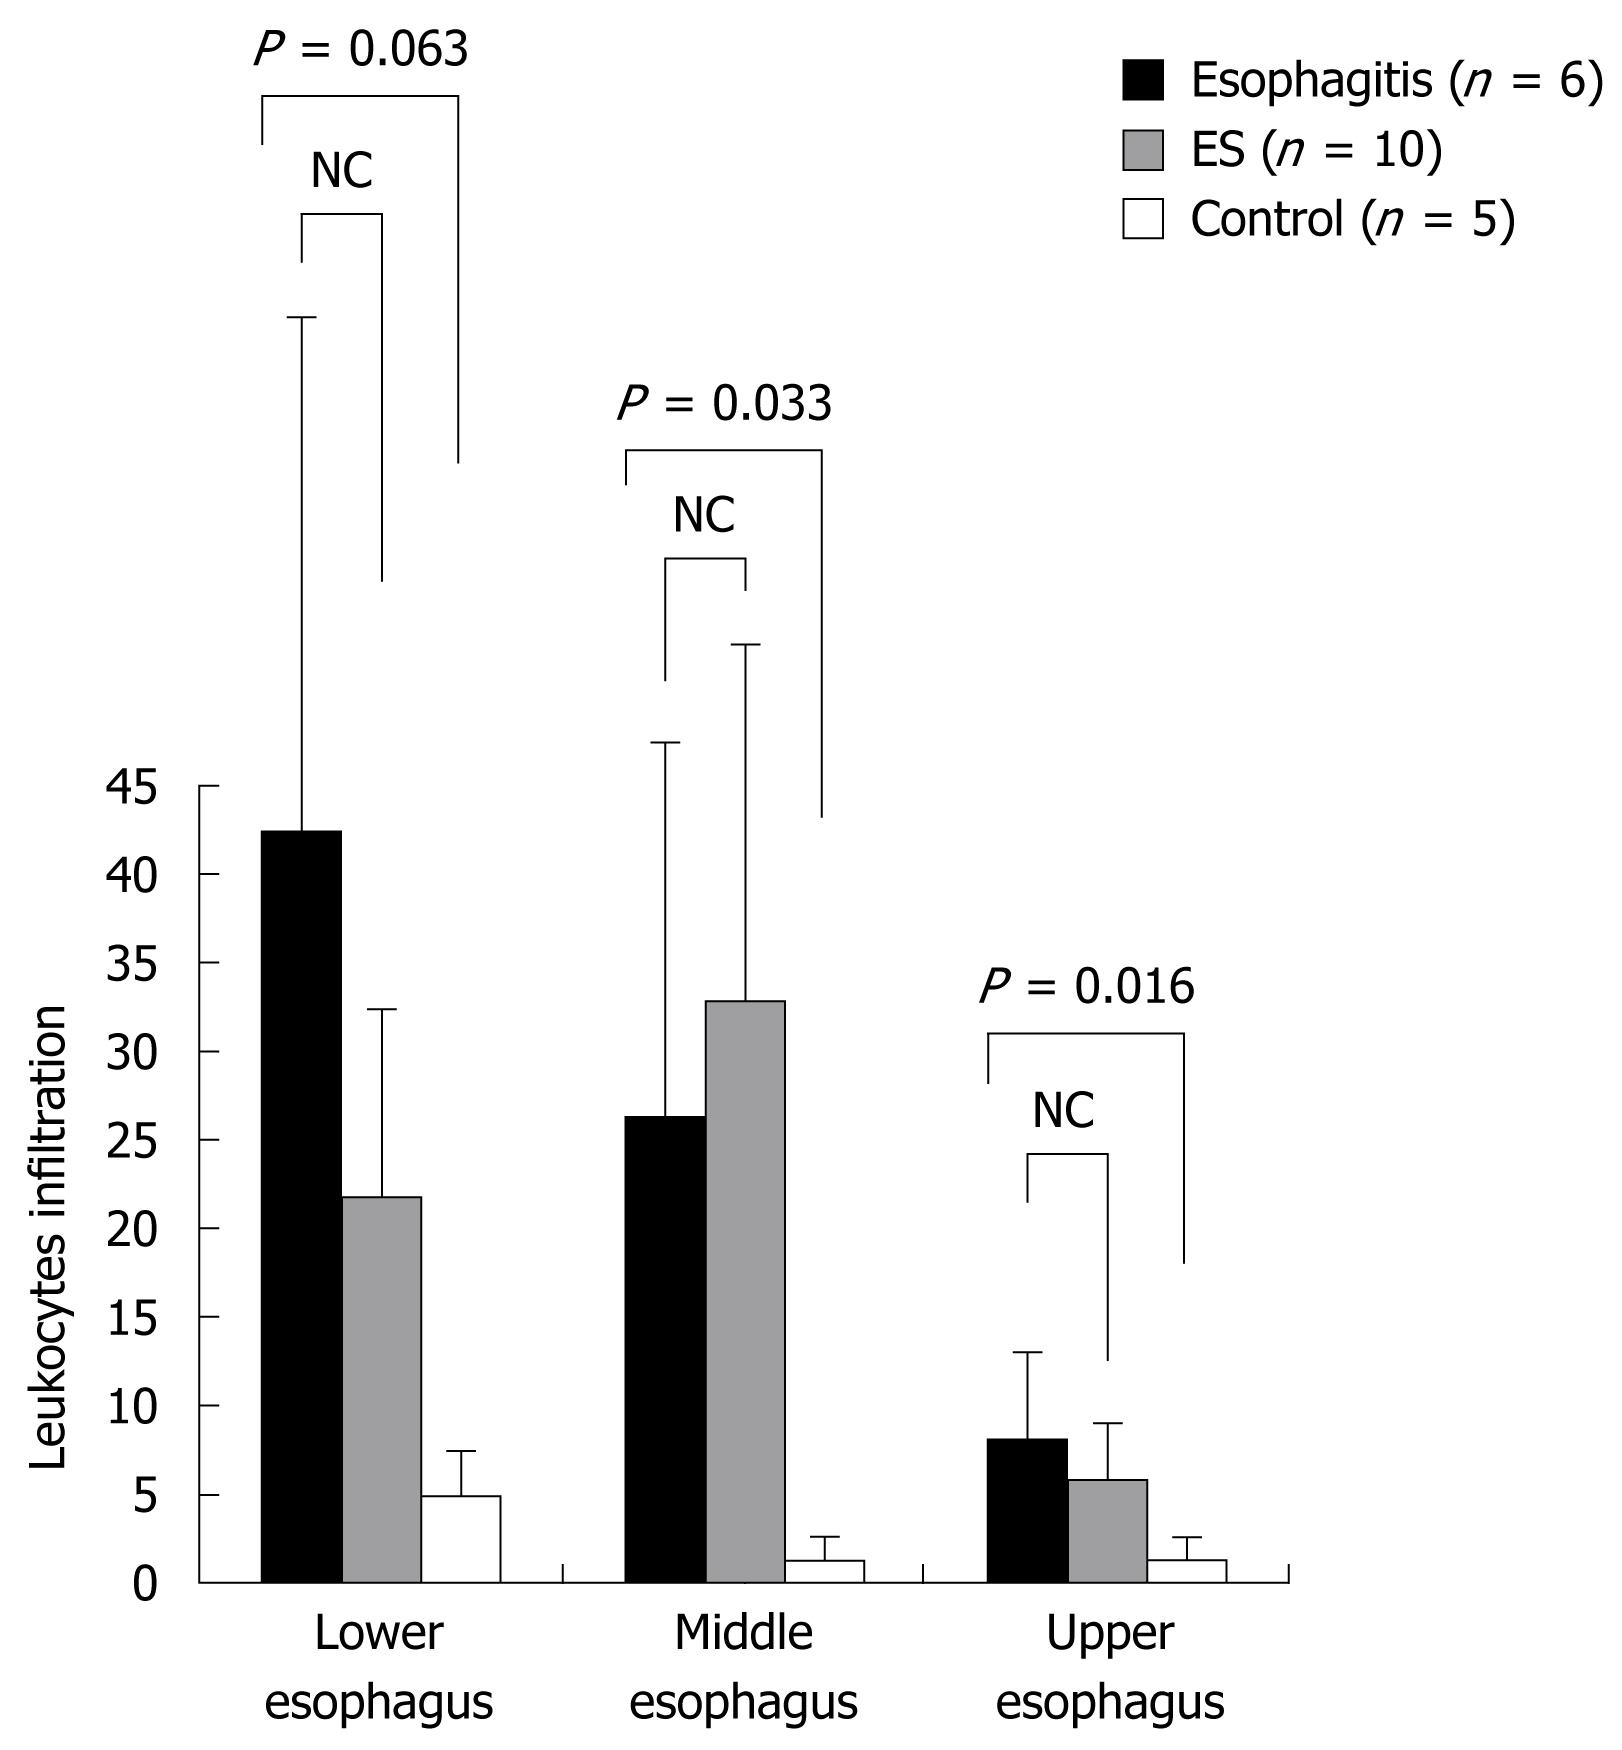
Figure 6 Leukocyte infiltration in the esophageal epithelium on day 7 after operation in the three groups.
In the esophagitis group, leukocyte infiltration in the middle and upper esophagus was significantly greater than that in the controls (P < 0.05).
- Citation: Asaoka D, Nagahara A, Oguro M, Izumi Y, Kurosawa A, Osada T, Kawabe M, Hojo M, Otaka M, Watanabe S. Characteristic pathological findings and effects of ecabet sodium in rat reflux esophagitis. World J Gastroenterol 2009; 15(28): 3480-3485
- URL: https://www.wjgnet.com/1007-9327/full/v15/i28/3480.htm
- DOI: https://dx.doi.org/10.3748/wjg.15.3480


