Copyright
©2009 The WJG Press and Baishideng.
World J Gastroenterol. Jul 7, 2009; 15(25): 3114-3121
Published online Jul 7, 2009. doi: 10.3748/wjg.15.3114
Published online Jul 7, 2009. doi: 10.3748/wjg.15.3114
Figure 1 Scatter plots showing correlation between absolute values and histopathological findings.
A: The absolute value in the arterial phase correlated significantly with the level of VEGF (r = 0.418, P = 0.047); B: The absolute value in the arterial phase correlated significantly with MVD (r = 0.649, P = 0.001); C: The absolute value in the arterial phase correlated significantly and negatively with the extent of fibrosis (r = -0.556, P = 0.006); D: The absolute value in the pancreatic phase correlated significantly and negatively with the extent of fibrosis (r = -0.488, P = 0.018); E: The absolute value in the late phase correlated significantly and negatively with the extent of fibrosis (r = -0.442, P = 0.035).
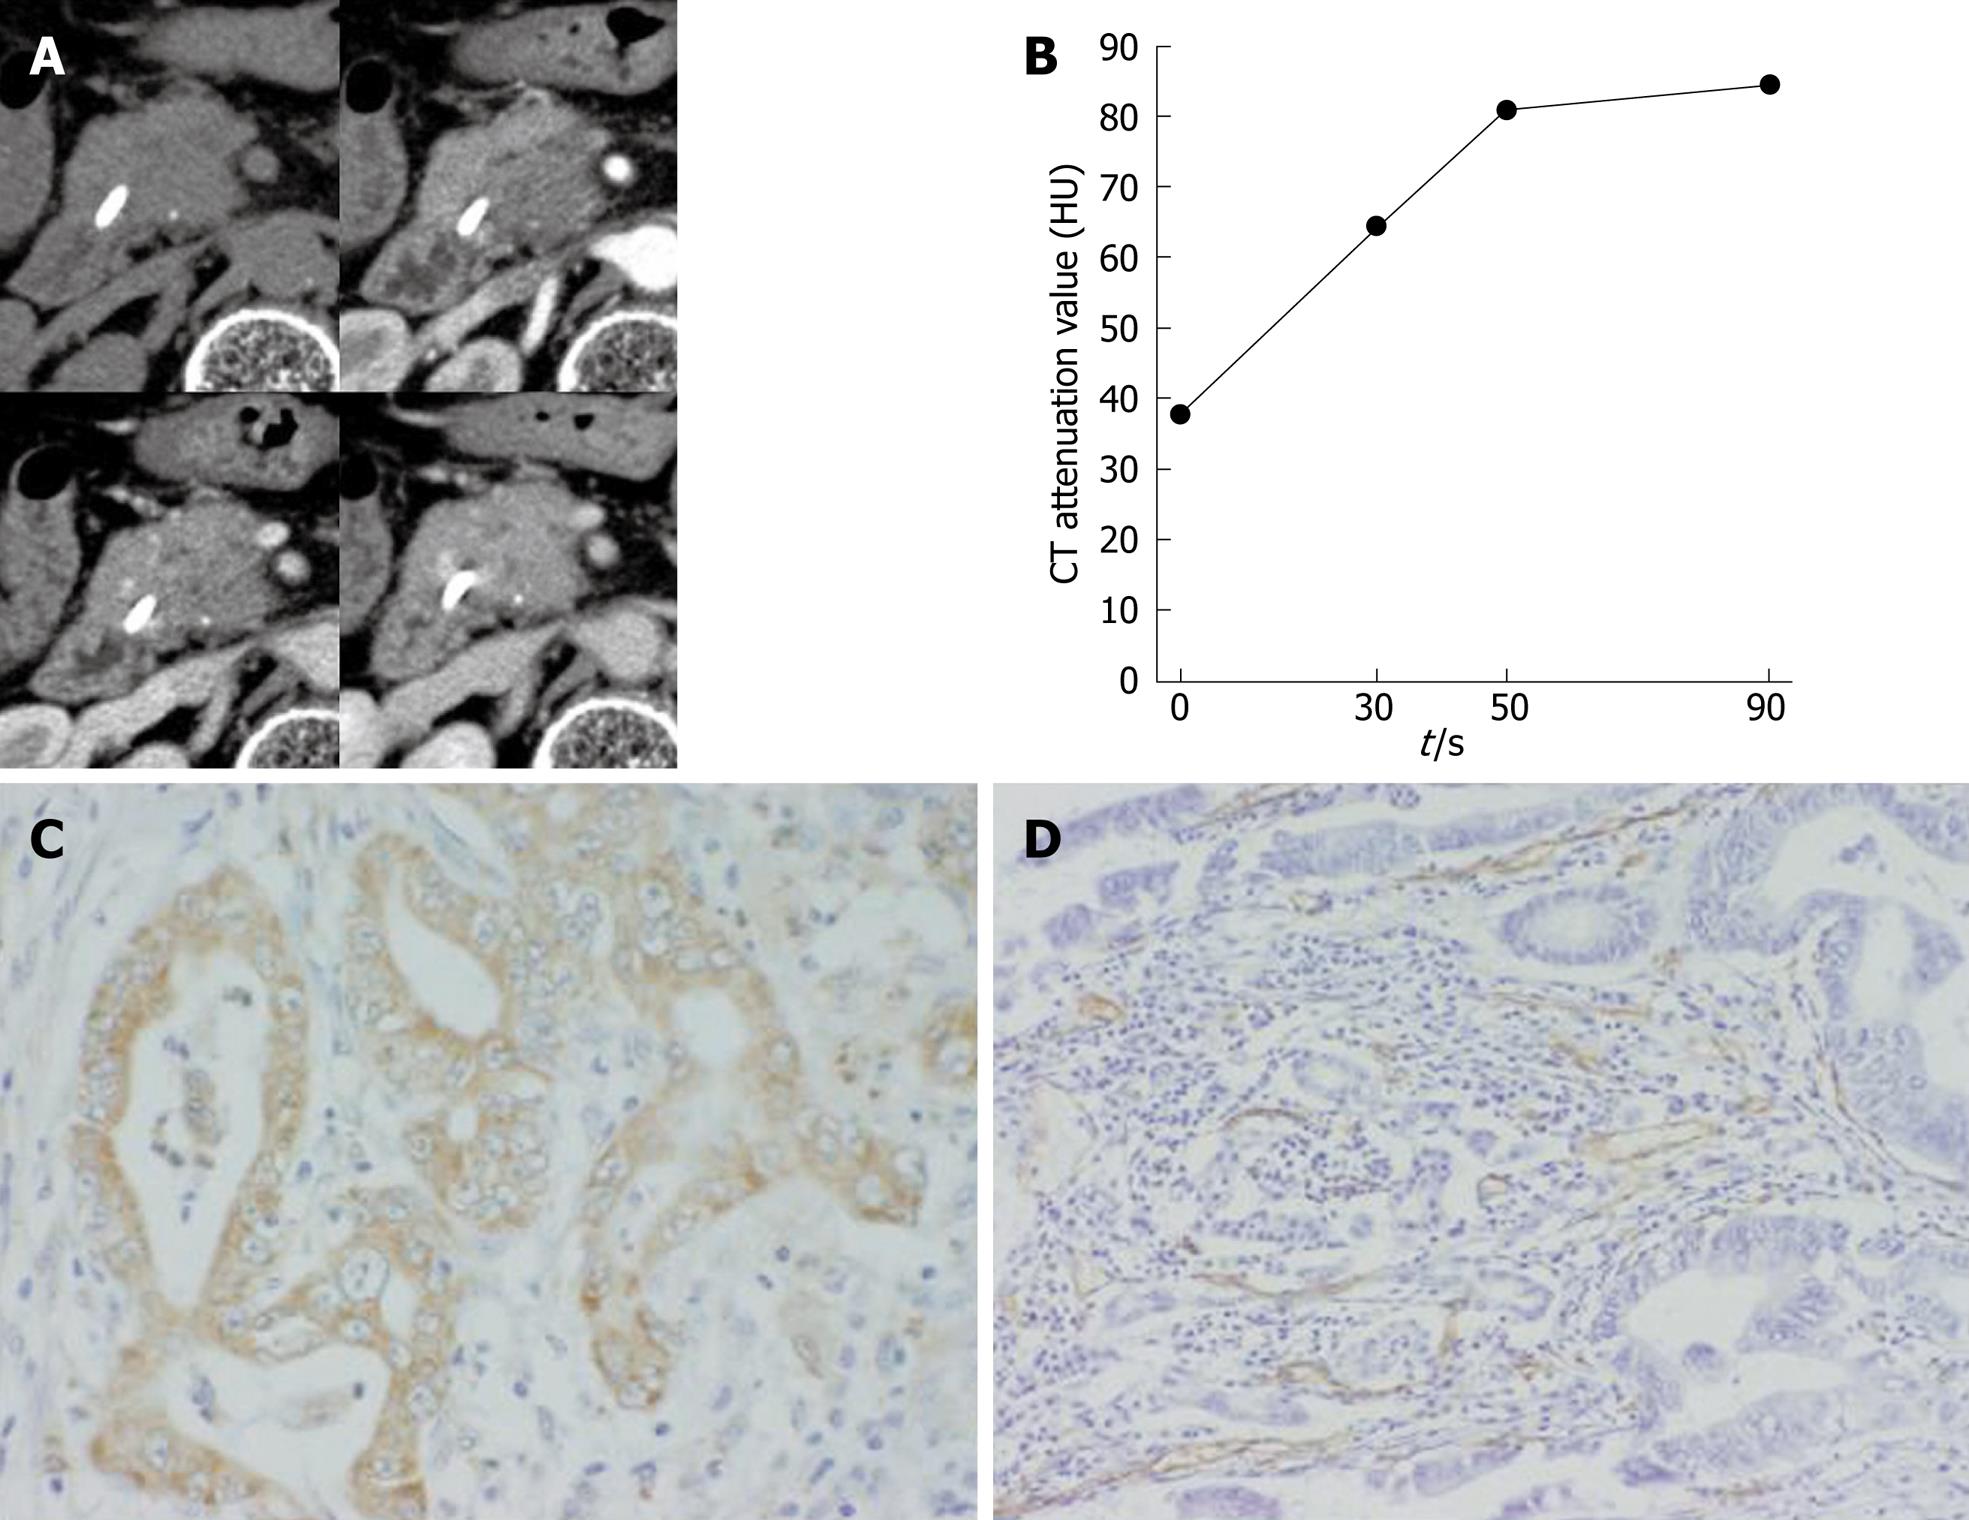
Figure 2 Moderately differentiated tubular adenocarcinoma in a 73-year-old woman.
A: Transverse dynamic CT images; B: Time-attenuation curve. Dynamic CT scans showing marked enhancement in the arterial phase; C: Photomicrograph showing immunoreactivity to VEGF, which is depicted as brown cytoplasm. The score was 4 (high expression) (Anti-VEGF stain; original magnification, × 400); D: Photomicrograph showing abundant microvessels and depicting vessel walls that appeared brown (Anti-CD34 stain; original magnification, × 200).
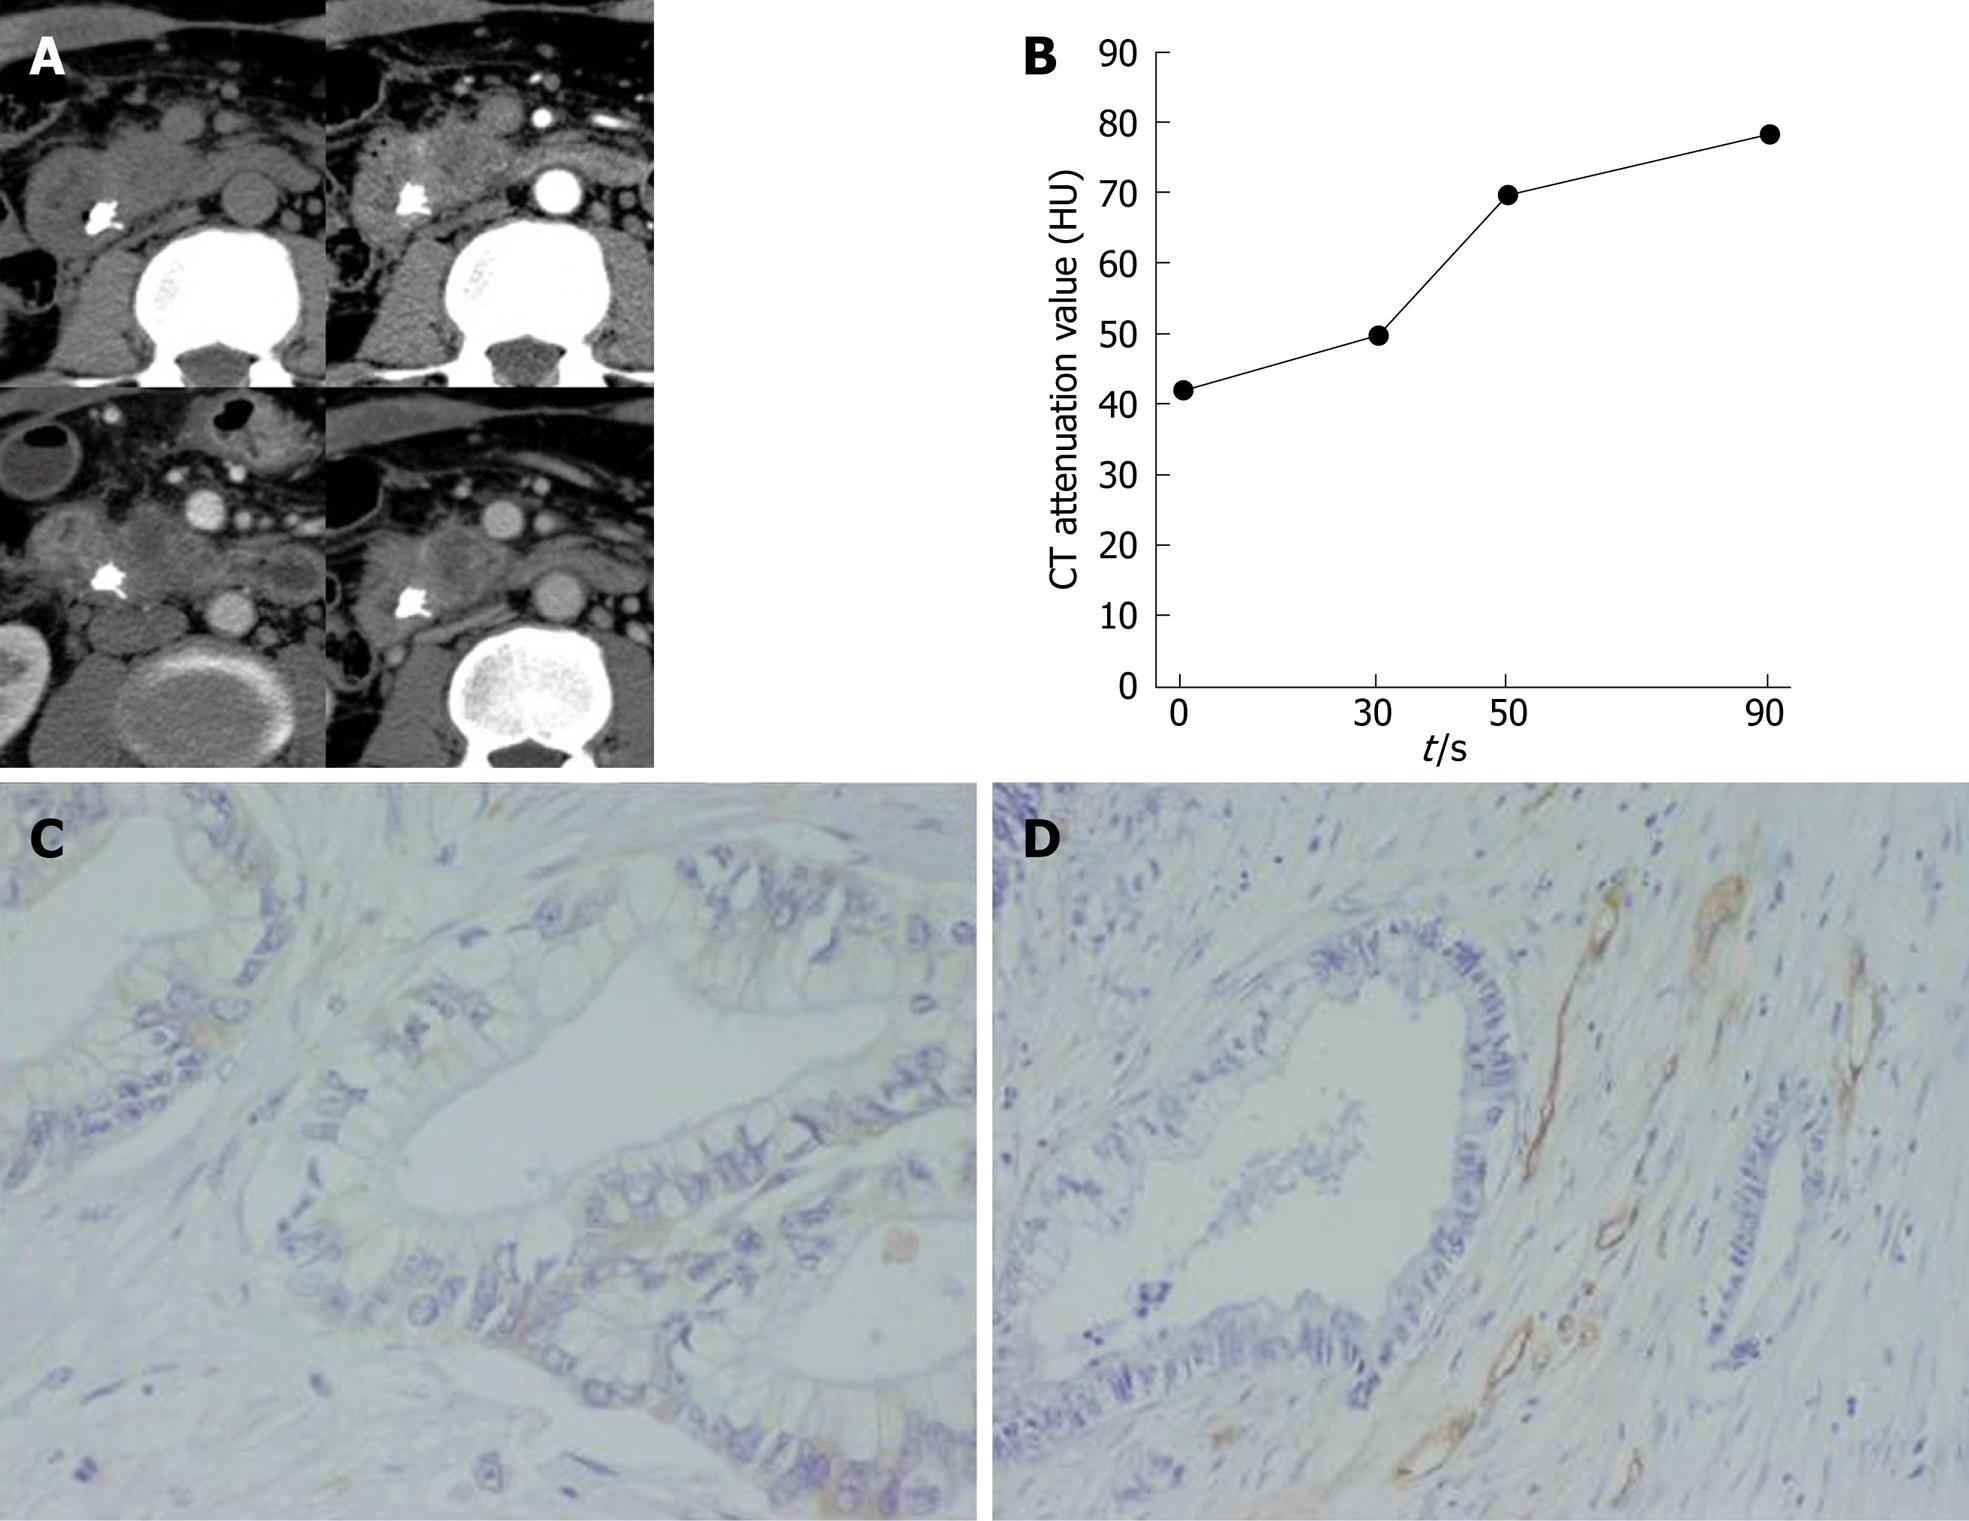
Figure 3 Well-differentiated tubular adenocarcinoma in a 44-year-old man.
A: Transverse dynamic CT images; B: Time-attenuation curve. Dynamic CT scans showing low enhancement in the arterial phase; C: Photomicrograph showing immunoreactivity to VEGF, which is depicted as brown cytoplasm. The score was 1 (extremely weak) (Anti-VEGF stain; original magnification, × 400); D: Photomicrograph showing few microvessels and depicting vessel walls, which appear brown (Anti-CD34 stain; original magnification, × 200).
Figure 4 Moderately differentiated tubular adenocarcinoma in a 79-year-old man.
A: Transverse dynamic CT images; B: Time-attenuation curve. Dynamic CT scans showing gradual enhancement; C: Photomicrograph showing abundant fibrosis and collagen fibers, which appear pink. The score was 3 (EVG stain; original magnification, × 40).
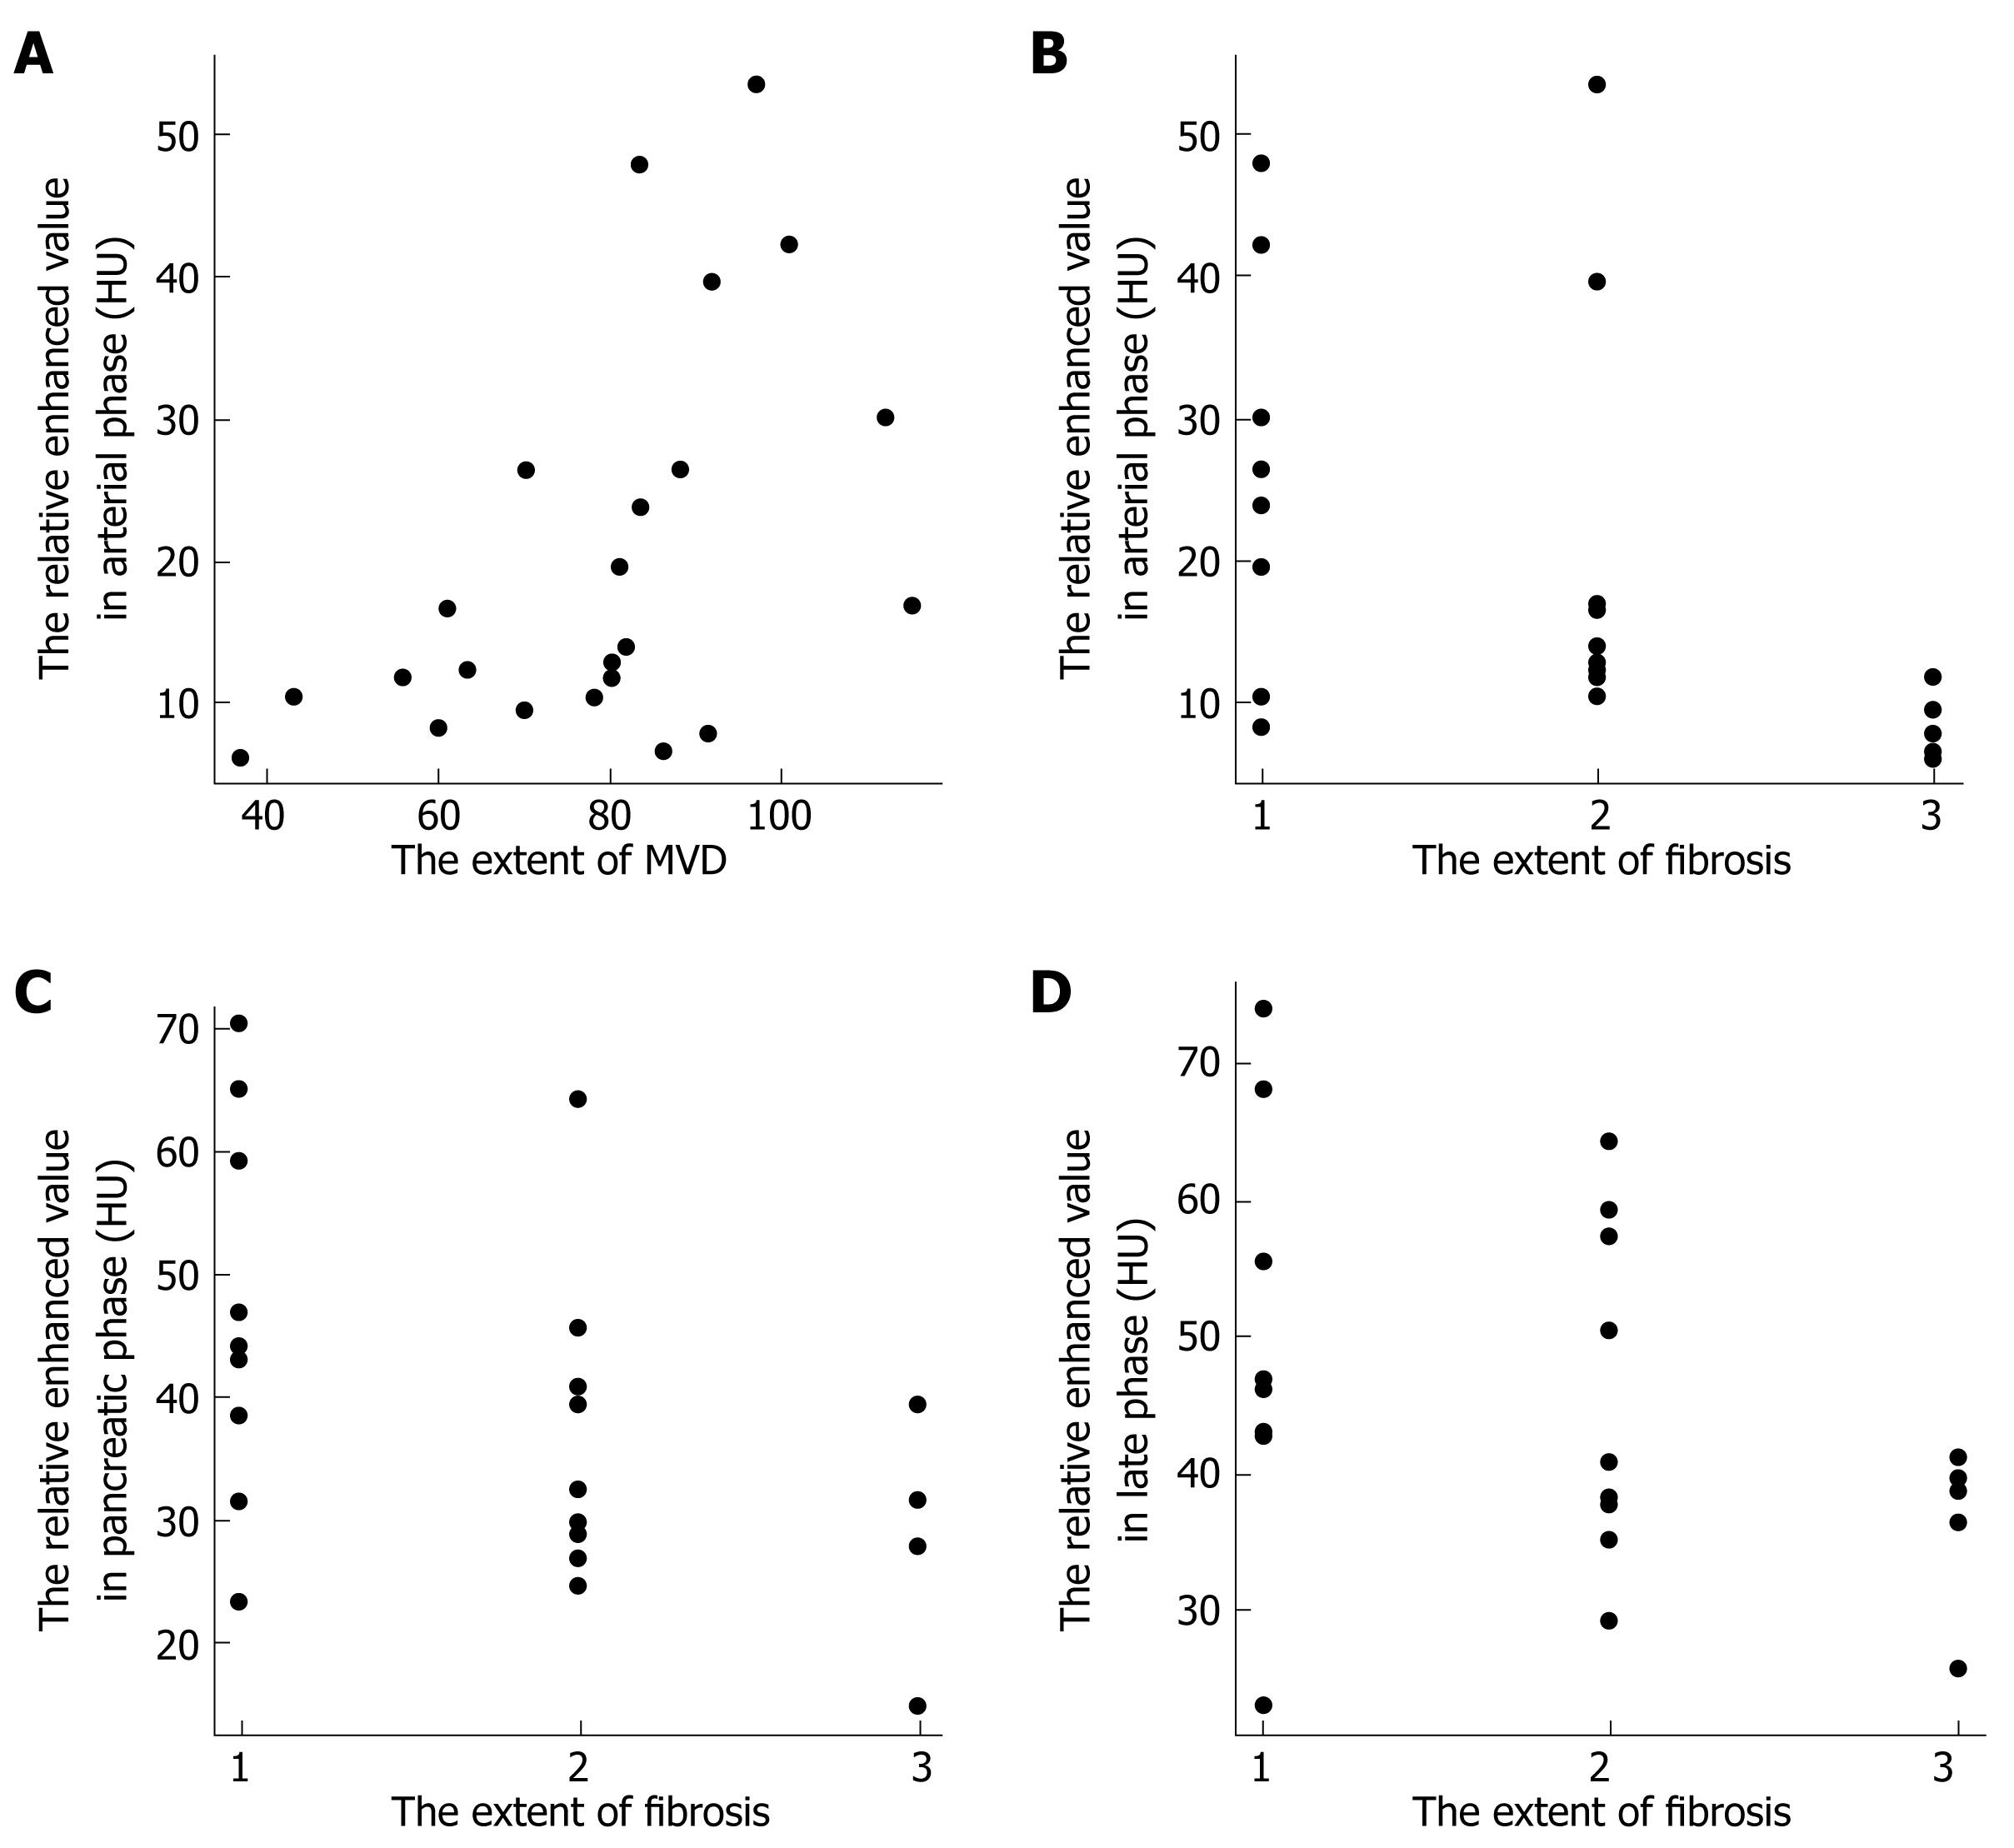
Figure 5 Scatter plots showing correlation between the relative enhanced values and histopathological findings.
A: The relatively enhanced value in the arterial phase correlated significantly with the extent of MVD (r = 0.593, P = 0.003); B: The relatively enhanced values in the arterial phase correlated significantly and negatively with the extent of fibrosis (r = -0.590, P = 0.003); C: The relatively enhanced values in the pancreatic phase correlated significantly and negatively with the extent of fibrosis (r = -0.483, P = 0.020); D: The relatively enhanced values in the late phase correlated significantly and negatively with the extent of fibrosis (r = -0.433, P = 0.039).
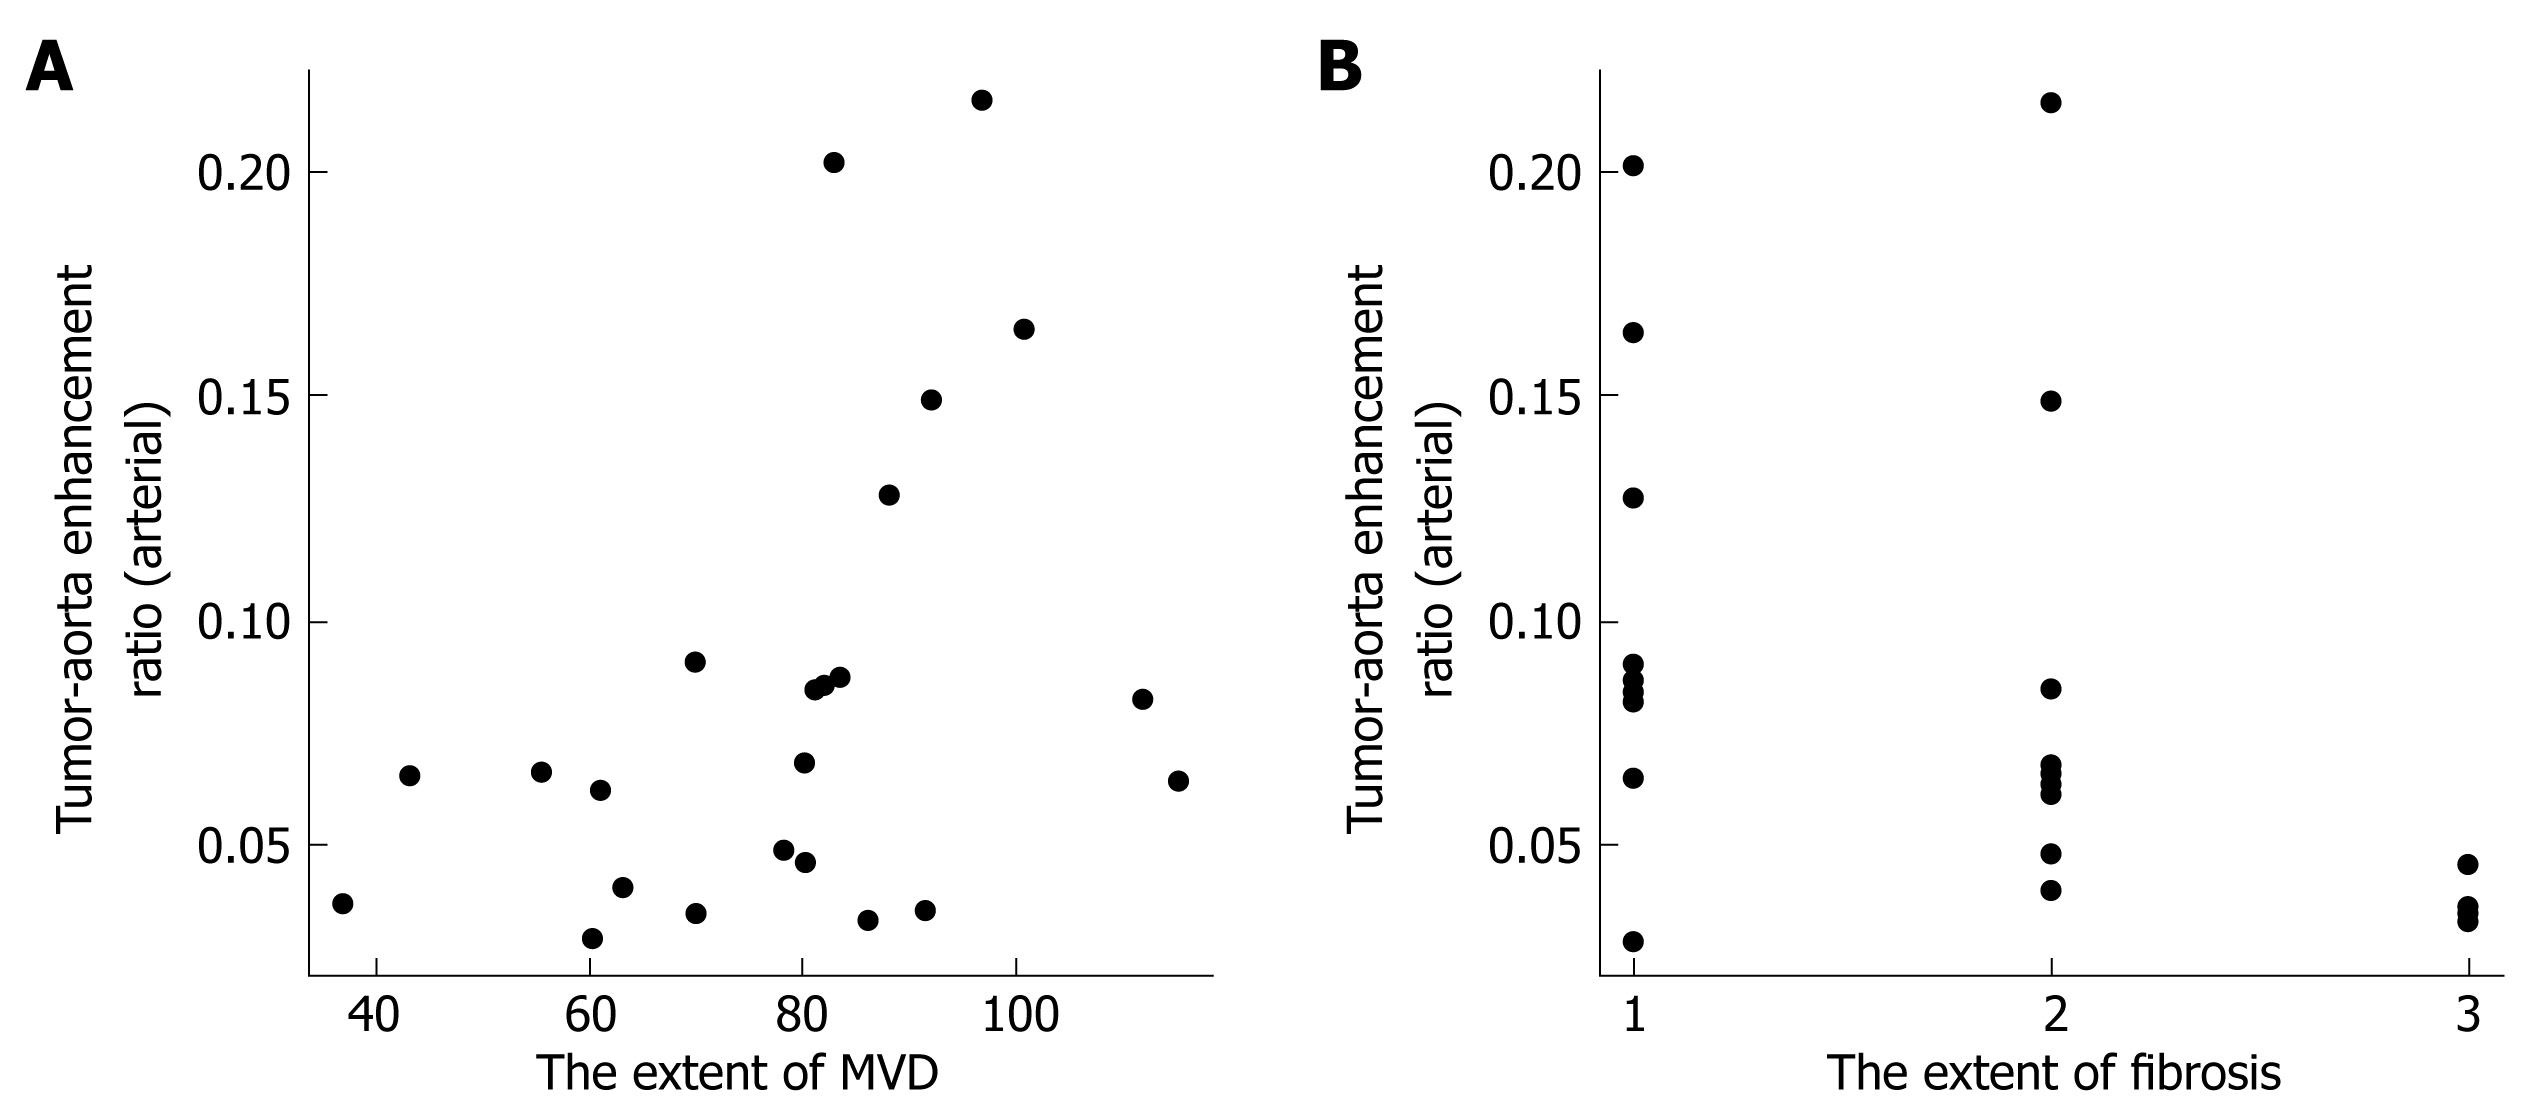
Figure 6 Scatter plots showing correlation between tumor-aorta enhancement ratio and histopathological findings.
A: Tumor-aorta enhancement ratio (arterial) was correlated positively with MVD (r = 0.477, P = 0.022); B: Tumor-aorta enhancement ratio (arterial) was correlated negatively with the extent of fibrosis (r = -0.575, P = 0.004).
- Citation: Hattori Y, Gabata T, Matsui O, Mochizuki K, Kitagawa H, Kayahara M, Ohta T, Nakanuma Y. Enhancement patterns of pancreatic adenocarcinoma on conventional dynamic multi-detector row CT: Correlation with angiogenesis and fibrosis. World J Gastroenterol 2009; 15(25): 3114-3121
- URL: https://www.wjgnet.com/1007-9327/full/v15/i25/3114.htm
- DOI: https://dx.doi.org/10.3748/wjg.15.3114


