Copyright
©2009 The WJG Press and Baishideng.
World J Gastroenterol. Apr 14, 2009; 15(14): 1708-1718
Published online Apr 14, 2009. doi: 10.3748/wjg.15.1708
Published online Apr 14, 2009. doi: 10.3748/wjg.15.1708
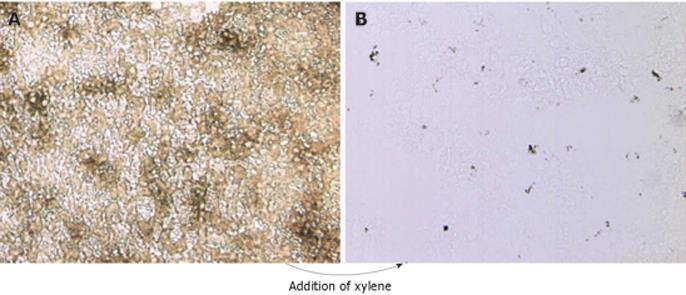
Figure 1 India-ink-positive cells revealed in tissue section overlaid with xylene.
A non-stained liver section derived from a mouse inoculated iv with India ink was not mounted (A), or was overlaid with xylene (B).
Figure 2 Carbon particles co-localize with ingested fluorescent latex beads and macrophages stained immunohistochemically.
A-C: Kupffer cells lining the liver sinusoids were identified by the presence of carbon particles in mice inoculated iv with India ink. Fluorescent latex beads mixed with India ink co-localized with the carbon particles. D-F: A carbon-particle-containing liver section was stained sequentially with streptavidin-conjugated anti-pan macrophage marker F4/80 and biotin-Cy3, and visualized by fluorescence microscopy. An accumulation of carbon particles stained intensely with F4/80 (white arrows), whereas single carbon spots (black arrows) were not stained with F4/80.
Figure 3 Experimental timeline.
Schematic outline of the experimental approach used to isolate Kupffer cells labeled in vivo with carbon. Notably, the elapsed time between liver dissection, sectioning and LCM of carbon-labeled Kupffer cells was only about 11 min.
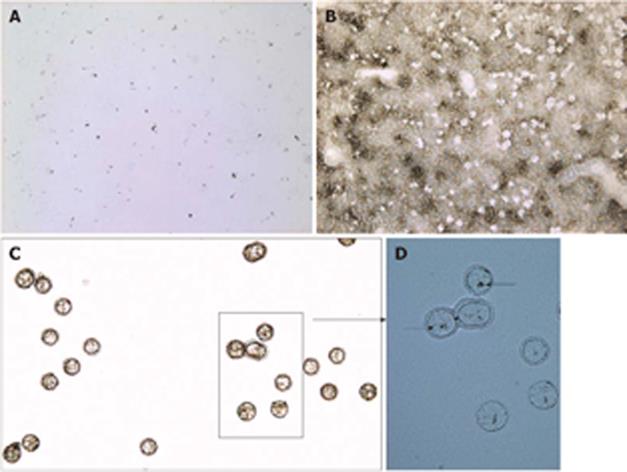
Figure 4 Images documenting LCM of carbon-labeled Kupffer cells.
A: Static image of carbon-labeled liver section overlaid with xylene (10 × magnification); B: Same tissue section after the evaporation of xylene and capture of carbon-labeled cells (10 ×); C: Captured cells visualized on the CapSure LCM cap (20 ×); D: Same cap mounted with water and a coverslip showing carbon within microdissected cells (arrows, 40 ×).
Figure 5 High quality RNA is extracted from material obtained by LCM.
RNA size and quality were analyzed with the Agilent 2100 Bioanalyzer. A, B: Profiles of total RNA extracted from scrapes of the entire liver section (A) and from laser-captured cells (B); C: Electrophoresis gel of the same RNA.
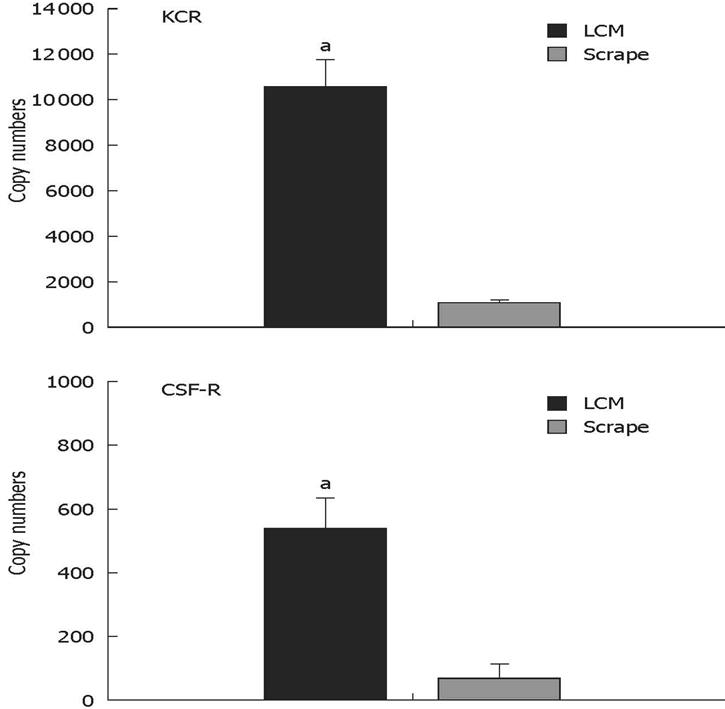
Figure 6 Kupffer-cell-specific mRNA transcripts are enriched in the laser-captured material.
Carbon-labelled cells or total liver section scrapes were obtained from three mice; Kupffer cell receptor and CSF-1 receptor mRNA transcripts were quantified by real-time RT-PCR. aSignificantly more than extracted from total tissue scrapes (P < 0.005; non-paired Student t test).
- Citation: Gehring S, Sabo E, Martin MES, Dickson EM, Cheng CW, Gregory SH. Laser capture microdissection and genetic analysis of carbon-labeled Kupffer cells. World J Gastroenterol 2009; 15(14): 1708-1718
- URL: https://www.wjgnet.com/1007-9327/full/v15/i14/1708.htm
- DOI: https://dx.doi.org/10.3748/wjg.15.1708


