Copyright
©2009 The WJG Press and Baishideng.
World J Gastroenterol. Mar 28, 2009; 15(12): 1443-1451
Published online Mar 28, 2009. doi: 10.3748/wjg.15.1443
Published online Mar 28, 2009. doi: 10.3748/wjg.15.1443
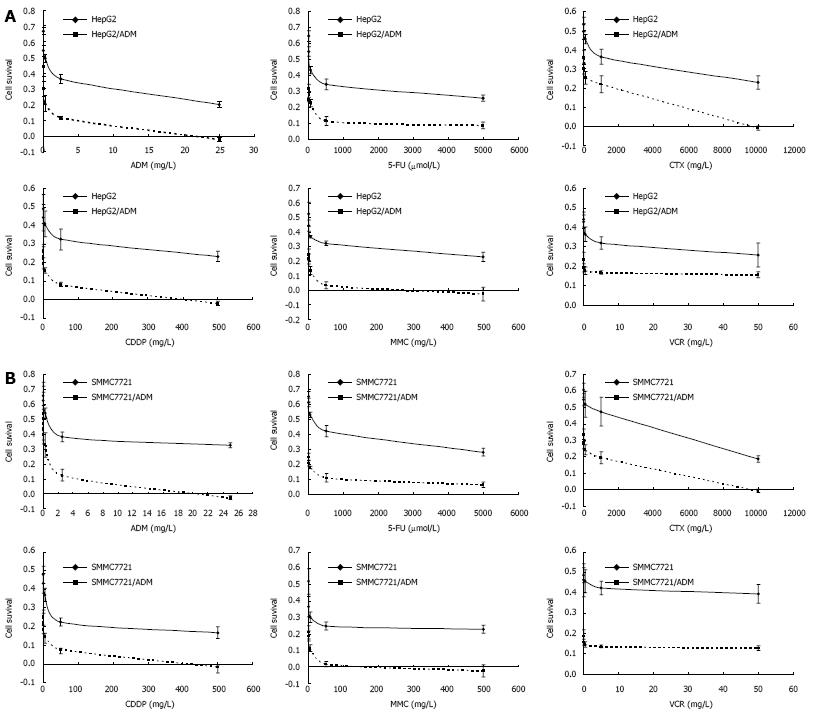
Figure 1 Measurement of cellular sensitivity to anticancer drugs and parental cells.
Cytotoxicity assay for adriamycin, fluorouracil, cyclophosphamide, tested cisplatin, mitomycin, and vincristine was performed to evaluate the IC50 for HepG2 and HepG2/ADM cells (A), SMMC7721 and SMMC7721/ADM cells (B). Dose response curves were derived from five independent experiments using MTT assay. The data were shown as mean ± SE.
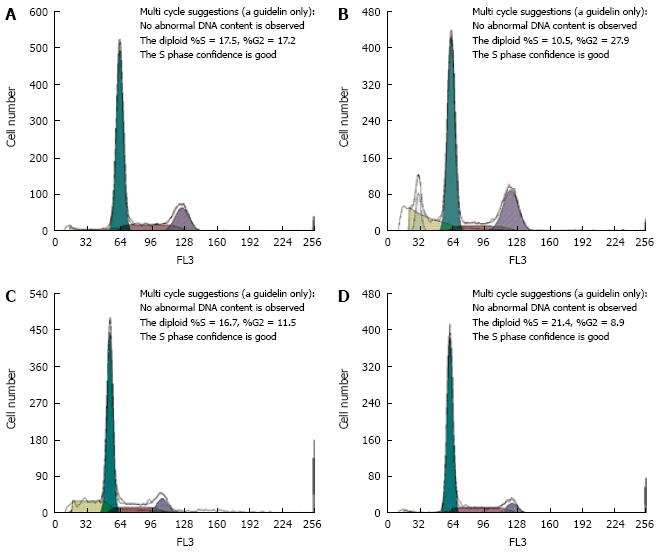
Figure 2 Cell cycle distributions in MDR and parental cells.
Cell cycle distributions of HepG2 (A), HepG2/ADM (B), SMMC7721 (C) and SMMC7721/ADM (D) cells were analyzed by flow cytometry as described in Materials and Methods.
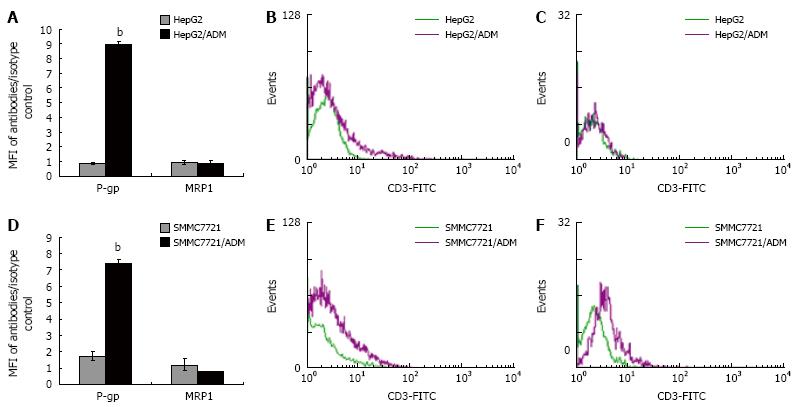
Figure 3 Expression of P-gp and MRP1 in MDR and parental cells.
Histograms showing that P-gp expression was over 10-fold higher in HepG2/ADM cells than in HepG2 cells, and over 4-fold higher in SMMC7721/ADM cells than in SMMC7721 cells, but MRP1 expression had no significant difference (A, D). Corresponding flow histograms for P-gp (B, E) and MRP1 (C, F) are presented. The results are shown as mean ± SE (n = 5). Statistical analyses comparing MDR cells with parental cells were performed using Student's t-test. bP < 0.001 vs SMMC7721 cells.
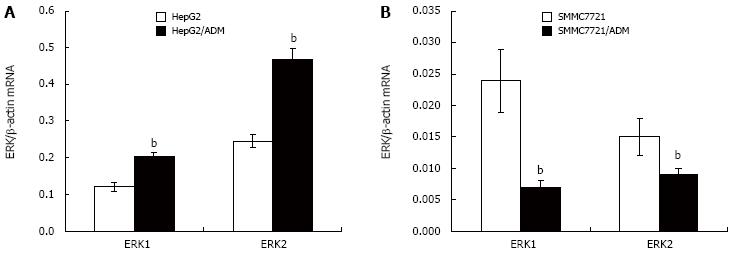
Figure 4 ERK1 and ERK2 mRNA expression in MDR and parental cells.
ERK1 and ERK2 mRNA levels were measured by QRT-PCR. A: HepG2/ADM and HepG2 cells; B: SMMC7721/ADM and SMMC7721 cells. Results were normalized by β-actin mRNA expression and compared with the levels in parental cells (n = 3). The results are shown as mean ± SE. Statistical analyses comparing MDR cells with parental cells were performed using Student's t-test. bP < 0.01 vs parental cells (data not shown).
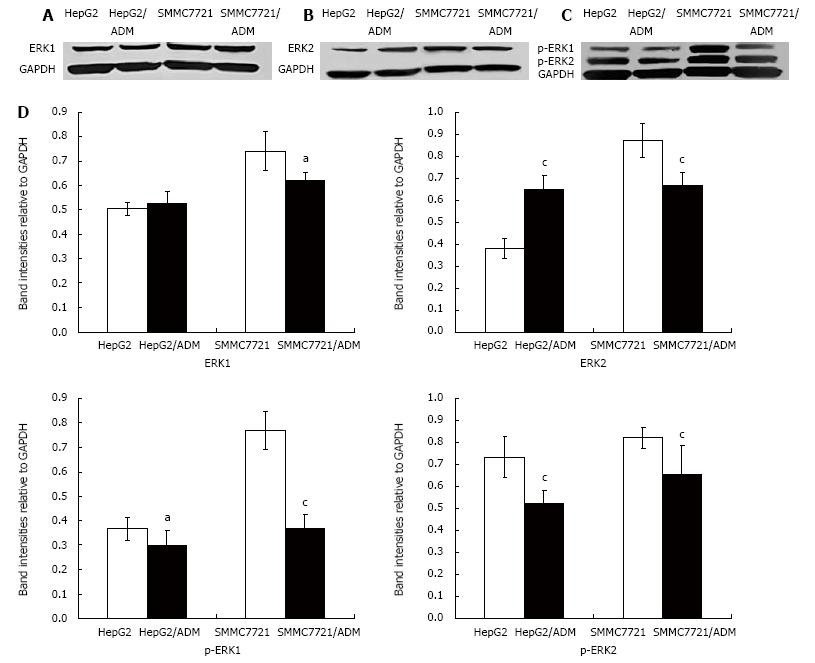
Figure 5 Expression and phosphorylation of ERK1 and ERK2 in MDR and parental cells.
Western blot analysis of the ERK1 (A), ERK2 (B), p-ERK1 and p-ERK2 (C) expression in HepG2/ADM, SMMC7721/ADM as well as in HepG2 and SMMC7721 cells (n = 3) was performed. The expression of ERK1 and ERK2 was markedly lower in SMMC7721/ADM cells than in parental cells. However, the ERK2 expression was markedly increased and the ERK1 expression had no significant change in HepG2/ADM cells. The phosphorylation of ERK1 and ERK2 was lower in MDR cells than in parental cells (D). The results are shown as mean ± SE. Statistical analyses comparing MDR cells with parental cells were performed using Student's t-test. aP < 0.05, cP < 0.01 vs parental cells (data not shown).
- Citation: Yan F, Wang XM, Pan C, Ma QM. Down-regulation of extracellular signal-regulated kinase 1/2 activity in P-glycoprotein-mediated multidrug resistant hepatocellular carcinoma cells. World J Gastroenterol 2009; 15(12): 1443-1451
- URL: https://www.wjgnet.com/1007-9327/full/v15/i12/1443.htm
- DOI: https://dx.doi.org/10.3748/wjg.15.1443


