Copyright
©2009 The WJG Press and Baishideng.
World J Gastroenterol. Mar 28, 2009; 15(12): 1431-1442
Published online Mar 28, 2009. doi: 10.3748/wjg.15.1431
Published online Mar 28, 2009. doi: 10.3748/wjg.15.1431
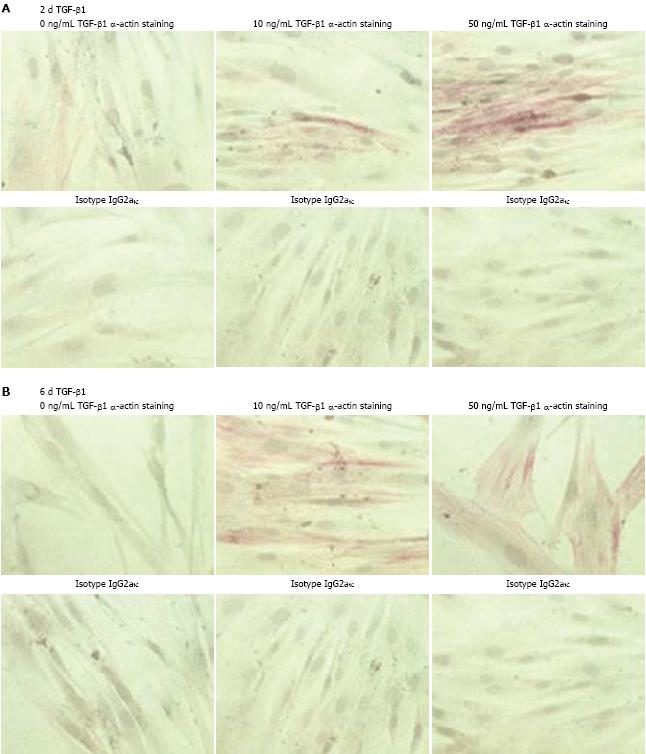
Figure 1 Effect of TGF-β1 on α-SMA production in CLPF.
CLPF were incubated for 2 d (A) or 6 d (B) with 0, 10 and 50 ng/mL TGF-β1. Subsequently, APAAP-staining of α-SMA (α-actin) or its isotype control IgG2a was performed. Incubation of CLPF for 6 d with 10 ng/mL or 50 ng/mL TGF-β1 showed the greatest effect on α-SMA, since almost all cells showed a red stainining for α-SMA.
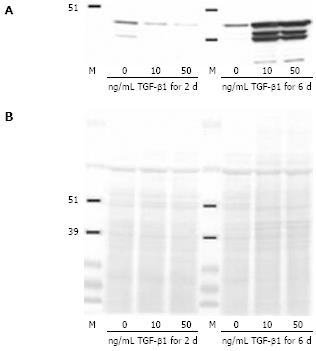
Figure 2 Effect of TGF-β1 on α-SMA protein production.
Control CLPF were incubated for 2 d or 6 d with 0, 10, and 50 ng/mL TGF-β1 in serum-free medium. Subsequently the cells were washed and lysed. Amounts of α-SMA were analyzed by Western blotting (A). Equal loading was confirmed by Ponceau S staining (B). Incubation of CLPF for 6 d with 10 ng/mL or 50 ng/mL TGF-β1 markedly enhanced α-SMA production.
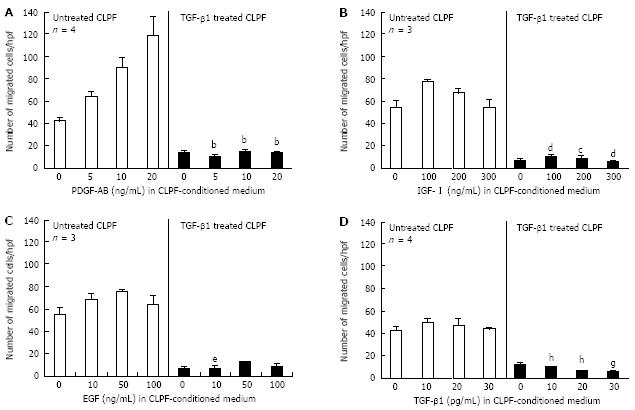
Figure 3 Effect of TGF-β1 on growth factor-induced migration of CLPF.
Control-CLPF were treated for 6 d with 10 ng/mL TGF-β1 and subsequently migration assays in the presence of PDGF-AB, IGF-I, EGF and TGF-β1 diluted in 24 h CLPF-conditioned medium were performed in the modified Boyden chamber. TGFβ1 treatment of CLPF significantly decreased the migratory potential, which could not be re-enhanced by cell migration-inducing growth factors. Statistics: The Mann-Whitney Rank Sum Test was used for the evaluation of the non-parametric data. A: bP < 0.0001 vs unstimulated CLPF; B: cP < 0.05, dP < 0.005 vs unstimulated CLPF; C: eP < 0.05 vs unstimulated CLPF; D: gP < 0.05, hP < 0.01 vs unstimulated CLPF.
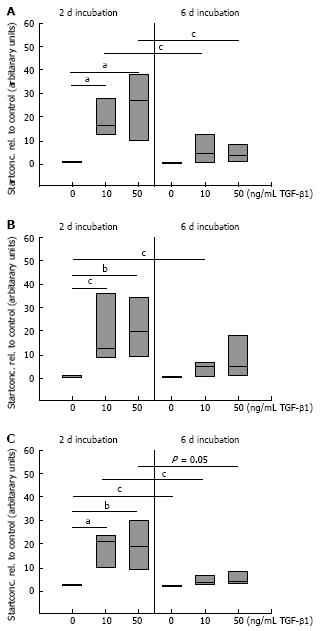
Figure 4 Quantitative mRNA analysis of FN (A) and the splicing forms FN ED-A (B) and FN ED-B (C) by real-time PCR in TGF stimulated CLPF.
TGF-β1 stimulated and untreated control-CLPF (n = 7) were lysed and mRNA was isolated. The cDNA start concentration of the untreated control group was set as 1. Compared to the control cells a dose-dependent increase in mRNA expression of FN, FN ED-A, and FN ED-B was determined. TGF-β1-stimulation for 2 d caused a higher increase in FN mRNA expression than after 6 d. Paired t-test: aP < 0.005; bP < 0.01; cP < 0.05.
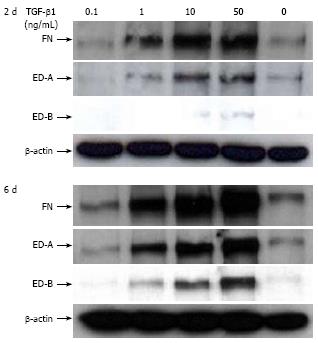
Figure 5 Effect of TGF-β1 on FN, FN ED-A, and FN ED-B protein in CLPF after 2 d and 6 d.
Control-CLPF were incubated for 2 d or 6 d with 0, 0.1, 1, 10, and 50 ng/mL TGF-β1 in serum-free medium. Subsequently cells were washed and lysed. Amounts of FN were quantified by Western blotting. Loading was checked by β-actin production. Incubation of CLPF for 6 d with TGF-β1 markedly enhanced the levels of FN, FN ED-A, and FN ED-B.
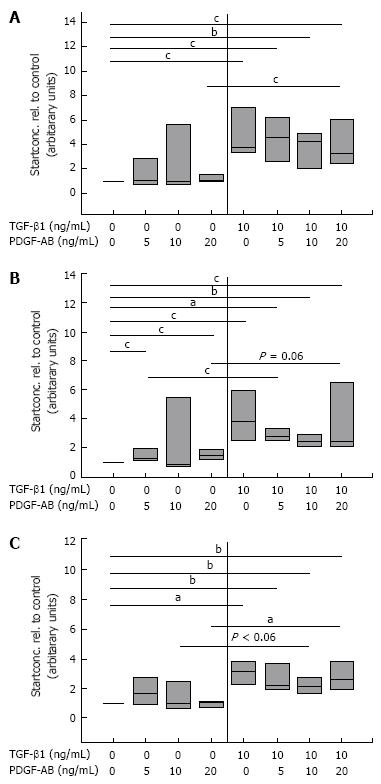
Figure 6 Quantitative mRNA analyses of FN (A) and the splicing forms FN ED-A (B), and FN ED-B (C) by real-time PCR in CLPF treated with TGF-β1.
Control CLPF (n = 7) were pre-incubated with and without 10 ng/mL TGF-β1 for 6 d, the monolayer wounded with a comb, and incubated for further 4 h with increasing concentrations of PDGF-AB in conditioned medium. mRNA was isolated and cDNA transcribed. cDNA start concentration of the untreated control (0 ng/mL TGF-β1 and 0 ng/mL PDGF-AB) was set as 1. Paired t-test: aP < 0.005; bP < 0.01; cP < 0.05.
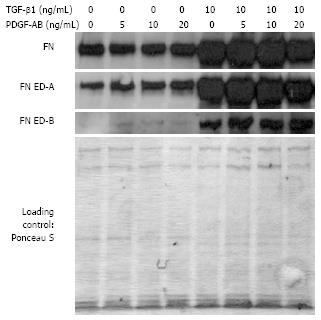
Figure 7 FN, FN ED-A, and FN ED-B protein levels of TGF-β1-pre-stimulated and unstimulated control CLPF in a wounding assay.
Isolated proteins were analyzed by Western blotting. Protein levels of FN, FN ED-A, and FN ED-B were increased by TGF-β1-pre-treatment compared to untreated control. Loading was checked by Ponceau S staining.
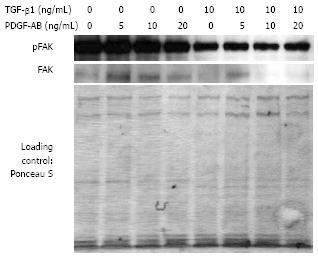
Figure 8 Analysis of FAK phosphorylation and FAK protein production of CLPF after TGF-β1 incubation in a wounding assay.
Isolated proteins were analyzed by Western blotting. Phospho-FAK and FAK decreased after 6 d TGF-β1 pretreatment in comparison to untreated controls. Loading was checked by Ponceau S staining.
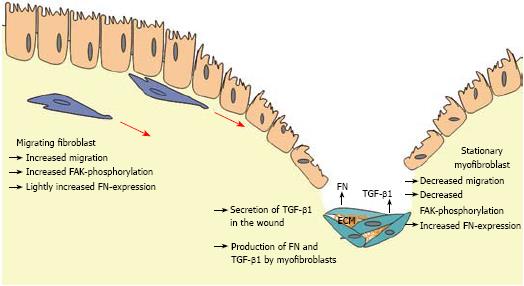
Figure 9 Schematic illustration of the role of TGF-β1, FN, and FAK in the development of fibrosis in CD.
After wounding TGF-β1 is produced by different cell types and connective tissue cells. CLPF increase FAK phosphorylation and migrate into the wound along the TGF-β1 gradient. FN that is also produced during migration induction and secreted at the site of injury may lead to an additional enhancement of the migratory gradient. Long term contact with TGF-β1 within the wound allows fibroblasts to differentiate into myofibroblasts. These cells have a reduced migratory potential and support wound healing via wound contraction and production of extracellular matrix deposition like FN. Phosphorylation of FAK is reduced after longer contact with TGF-β1 due to the differentiation into ECM-producing myofibroblasts.
- Citation: Brenmoehl J, Miller SN, Hofmann C, Vogl D, Falk W, Schölmerich J, Rogler G. Transforming growth factor-β1 induces intestinal myofibroblast differentiation and modulates their migration. World J Gastroenterol 2009; 15(12): 1431-1442
- URL: https://www.wjgnet.com/1007-9327/full/v15/i12/1431.htm
- DOI: https://dx.doi.org/10.3748/wjg.15.1431


