Copyright
©2009 The WJG Press and Baishideng.
World J Gastroenterol. Mar 14, 2009; 15(10): 1267-1272
Published online Mar 14, 2009. doi: 10.3748/wjg.15.1267
Published online Mar 14, 2009. doi: 10.3748/wjg.15.1267
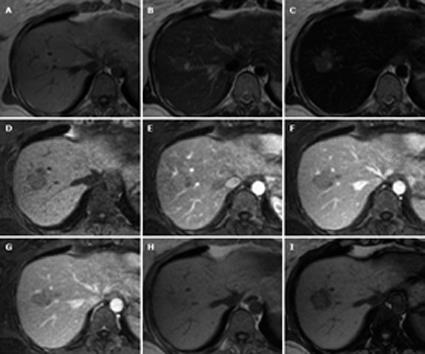
Figure 1 Magnetic resonance imaging (MRI).
A: T1; B: T2; C: T2-SPIO; D: Plain; E: Arterial phase; F Portal phase; G: Delayed phase; H: T1 in phase; I: T1 opposed phase.
Figure 2 Computed tomography (CT) in March 2007.
A: Plain; B: Arterial phase; C: Portal phase; D: Delayed phase.
Figure 3 CT in July 2007.
A: Plain; B: Arterial phase; C: Portal phase; D: Delayed phase.
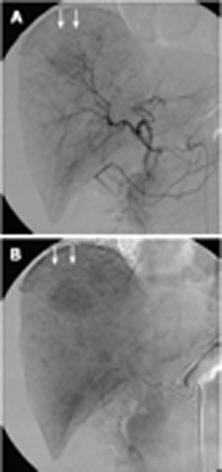
Figure 4 Digital subtraction angiography (DSA).
A: Arterial phase; B: Liver parenchymal phase. Arrow: Tumor stain.
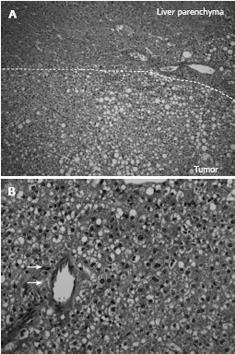
Figure 5 Pathological findings.
A: Hematoxylin and eosin staining, original magnification, × 50; B: Hematoxylin and eosin staining, original magnification, × 200. Arrow: Myogenic artery.
- Citation: Kogure T, Ueno Y, Sekiguchi S, Ishida K, Igarashi T, Wakui Y, Iwasaki T, Shimosegawa T. Liver cell adenoma showing sequential alteration of radiological findings suggestive of well-differentiated hepatocellular carcinoma. World J Gastroenterol 2009; 15(10): 1267-1272
- URL: https://www.wjgnet.com/1007-9327/full/v15/i10/1267.htm
- DOI: https://dx.doi.org/10.3748/wjg.15.1267


