©2008 The WJG Press and Baishideng.
World J Gastroenterol. Feb 21, 2008; 14(7): 1067-1076
Published online Feb 21, 2008. doi: 10.3748/wjg.14.1067
Published online Feb 21, 2008. doi: 10.3748/wjg.14.1067
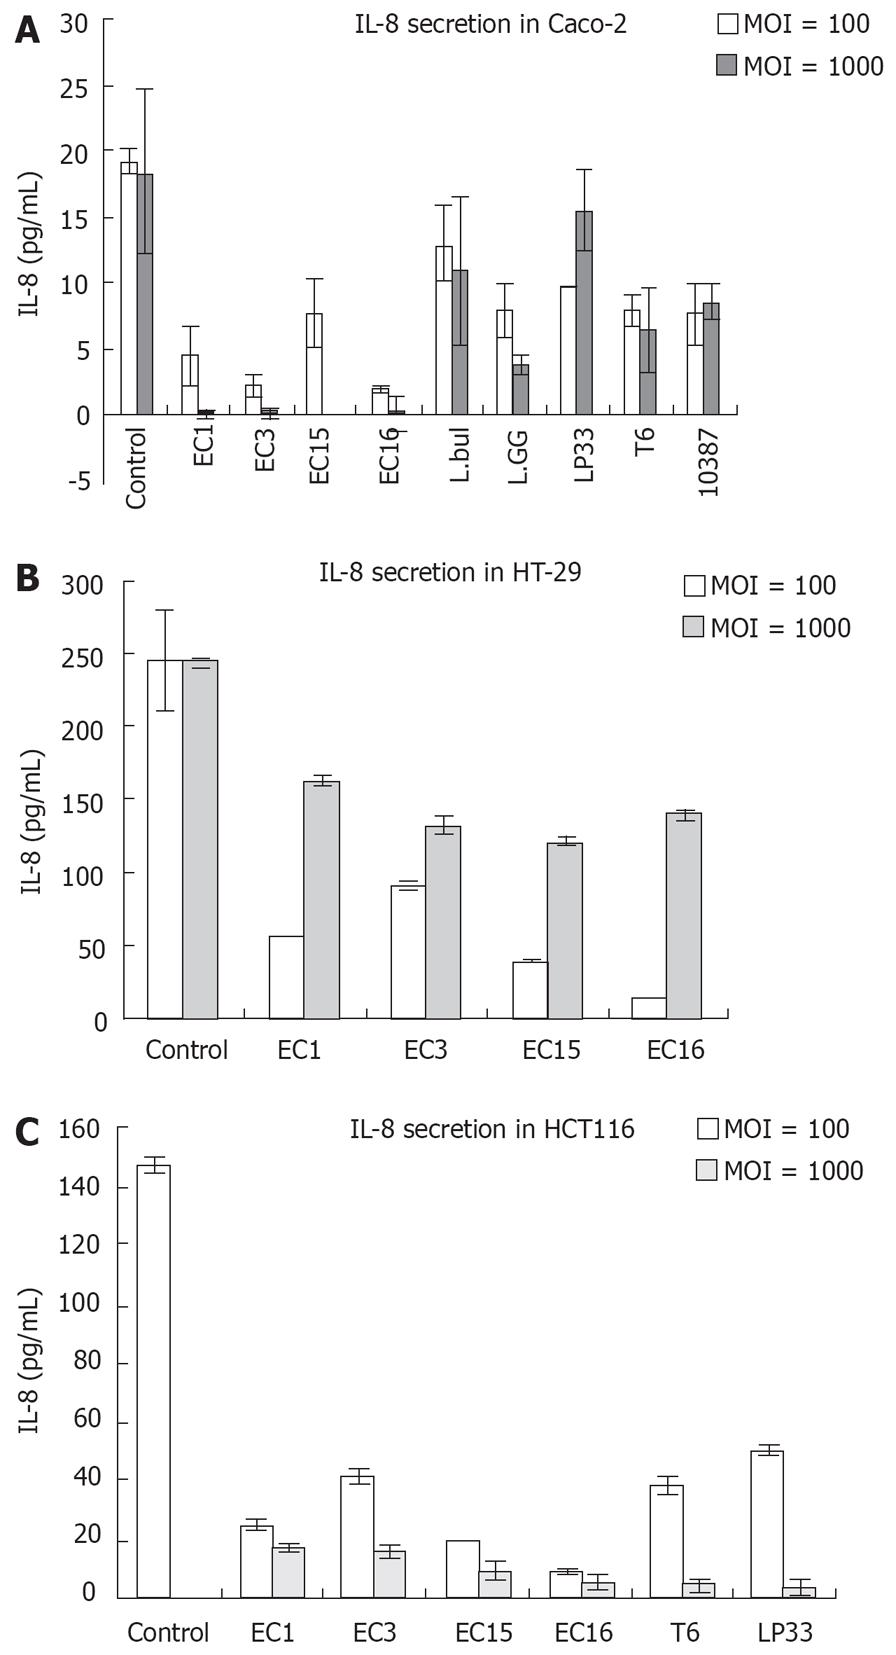
Figure 1 IL-8 production in Caco-2 (A), HT-29 (B) and HCT116 (C) cells treated with LAB for 6 h.
Results are shown as mean ± SD of three independent experiments.
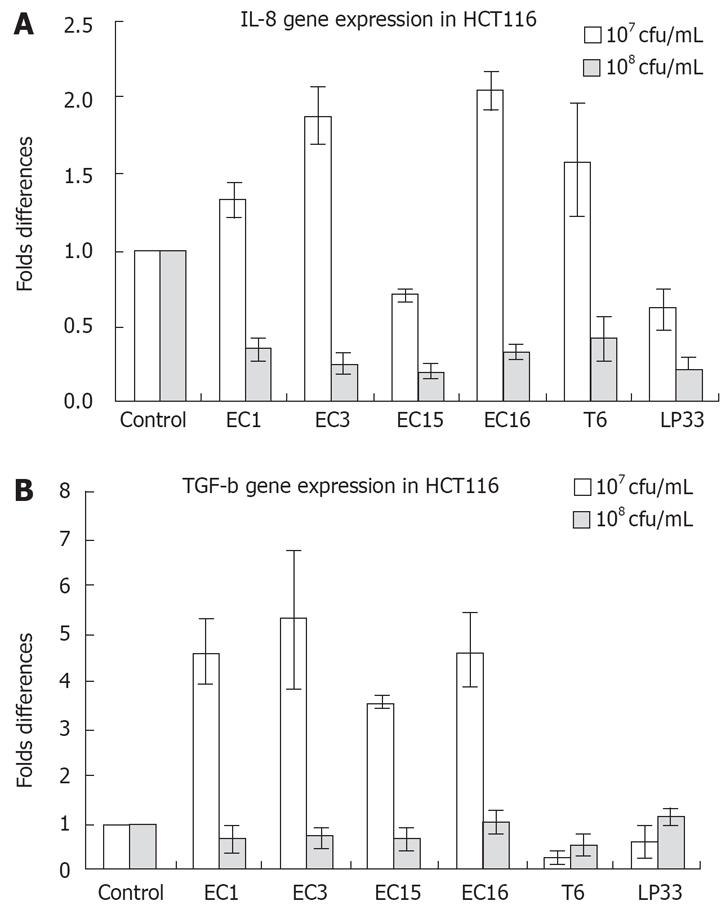
Figure 2 Different cytokines expression in HCT116 cells.
RT-PCR analysis was used to determine IL-8 (A) and TGF-β (B) expression. 107 and 108 cfu/mL E. faecalis (EC1, EC3, EC15, EC16), LP33 and T6 were treated with HCT116, mRNA expression of the cytokines were analyzed as described in Materials and Methods. Quantitative densitometry was carried out on EtBr-stained gels and the results from three independent experiments were compiled to produce the data shown (mean ± SD). The gel densities were normalized against β-actin.
Figure 3 Induction of TLR3, TLR9 and TRAF6 mRNA expression in HCT116 cell line by E.
faecalis (EC1, EC3, EC15, and EC16), T6, and LP33. The above LAB were added to HCT116 cells as described in Materials and Methods. RT-PCR analysis was used to determine their mRNA expression. “C” represents control using culture medium only. “+” is positive control in PCR reactions using specific plasmid.
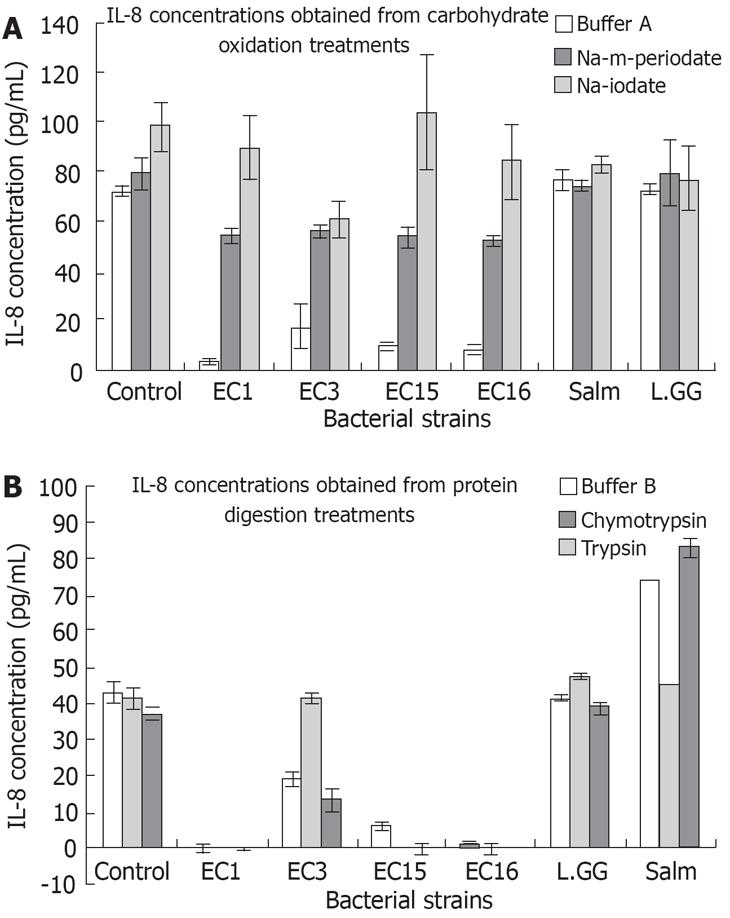
Figure 4 IL-8 secretion in HCT116 upon bacteria with carbohydrates oxidation and protein digestion.
A: IL-8 concentrations obtained in HCT116 from treatments using bacteria with oxidized cell wall carbohydrates; B: IL-8 concentrations obtained in HCT116 from treatments using chymotrypsin- and trypsin-digested bacterial cell wall proteins in buffer B. Experiments were repeated three times independently. Standard deviations were indicated as error bars.
Figure 5 IL-8 secretion in HCT116 cells treated with three Lectins.
Three lectins were added to HCT116 cells as described in Material and Methods. Experiments were repeated three times independently. Standard deviations were indicated as error bars.
Figure 6 Monolayer of HCT116 cells with or without attached bacteria observed using light microscopy at 1000 ×.
EC15 was used as a representation. A: Monolayer of HCT116 cells without bacteria treatment observed using light microscopy at 1000 ×; B: Monolayer of HCT116 cells with attached E. faecalis EC15 observed using light microscopy at 1000 ×; C: Monolayer of HCT116 cells with m-periodate treated E. faecalis EC15 observed using light microscopy at 1000 ×.
-
Citation: Wang S, Ng LHM, Chow WL, Lee YK. Infant intestinal
Enterococcus faecalis down-regulates inflammatory responses in human intestinal cell lines. World J Gastroenterol 2008; 14(7): 1067-1076 - URL: https://www.wjgnet.com/1007-9327/full/v14/i7/1067.htm
- DOI: https://dx.doi.org/10.3748/wjg.14.1067


