©2008 The WJG Press and Baishideng.
World J Gastroenterol. Nov 28, 2008; 14(44): 6844-6852
Published online Nov 28, 2008. doi: 10.3748/wjg.14.6844
Published online Nov 28, 2008. doi: 10.3748/wjg.14.6844
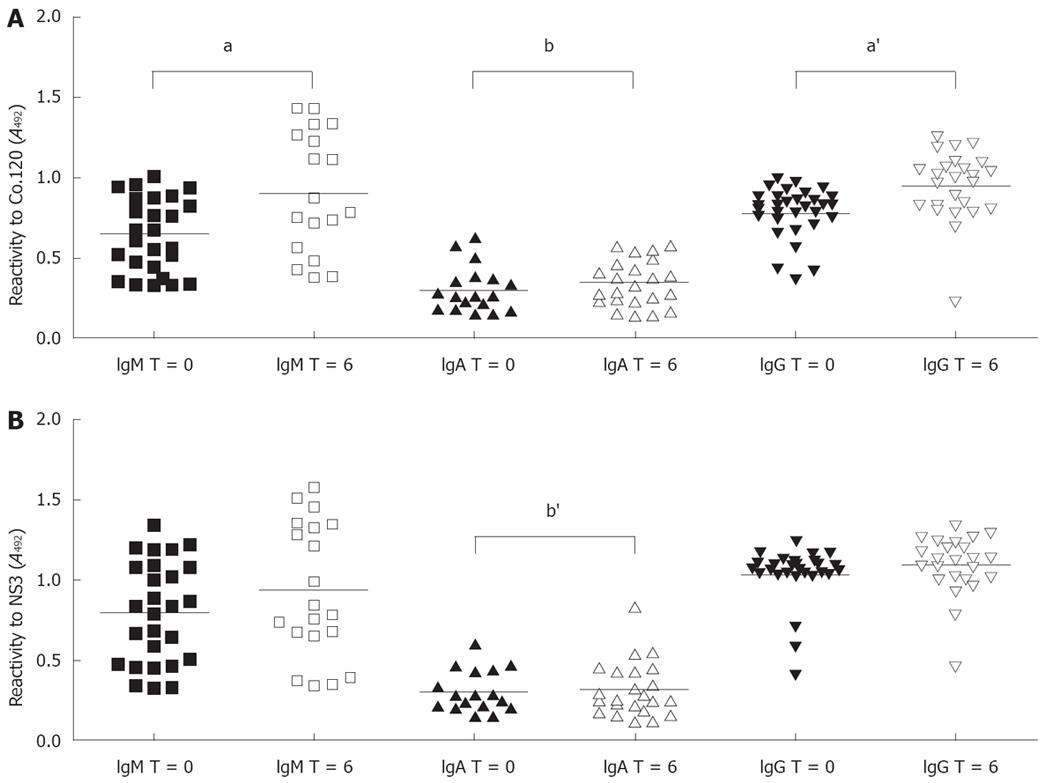
Figure 1 Comparison of antibody reactivity to HCV recombinant Co.
120 (A) and NS3 (B) proteins in serum samples from baseline (T = 0) and 6 mo (T = 6) of follow-up. Symbols represent individual values. Only samples showing a positive reactivity are displayed. The horizontal lines represent mean values. Letters over brackets indicate statistical significance (a denotes differences in response magnitude, aP = 0.027, a'P = 0.0006; b denotes differences in the number of positive samples, bP = 0.017, b'P = 0.005).
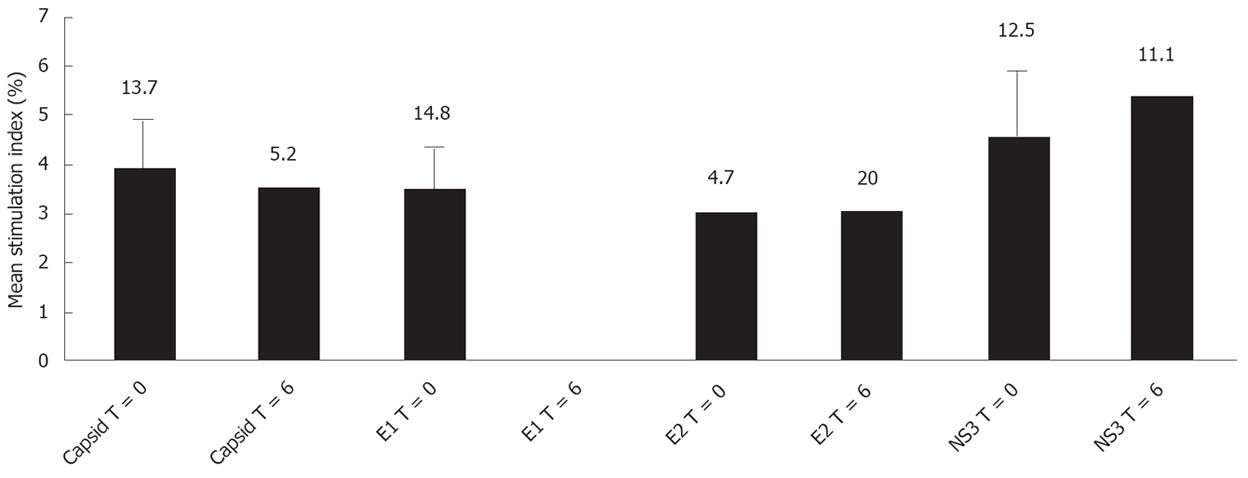
Figure 2 Comparison of CD8+ T cell proliferative response to HCV structural and non-structural antigens in baseline and six months follow up samples.
Bars represent mean stimulation index of positive samples only. Error bars represent standard deviation of the mean. Numbers above bars indicate percent of positive samples.
- Citation: Amador-Cañizares Y, Alvarez-Lajonchere L, Guerra I, Rodríguez-Alonso I, Martínez-Donato G, Triana J, González-Horta EE, Pérez A, Dueñas-Carrera S. Induction of IgA and sustained deficiency of cell proliferative response in chronic hepatitis C. World J Gastroenterol 2008; 14(44): 6844-6852
- URL: https://www.wjgnet.com/1007-9327/full/v14/i44/6844.htm
- DOI: https://dx.doi.org/10.3748/wjg.14.6844


