©2008 The WJG Press and Baishideng.
World J Gastroenterol. Nov 7, 2008; 14(41): 6421-6424
Published online Nov 7, 2008. doi: 10.3748/wjg.14.6421
Published online Nov 7, 2008. doi: 10.3748/wjg.14.6421
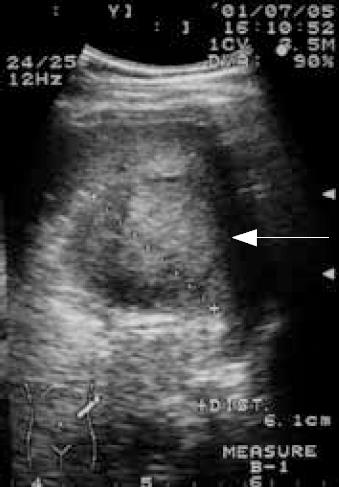
Figure 1 Sonography showed a well-defined encapsulated tumor, 6.
3 cm × 6.1 cm in size, over the spleen with hyperechoic density in the central portion (arrow) of the tumor.
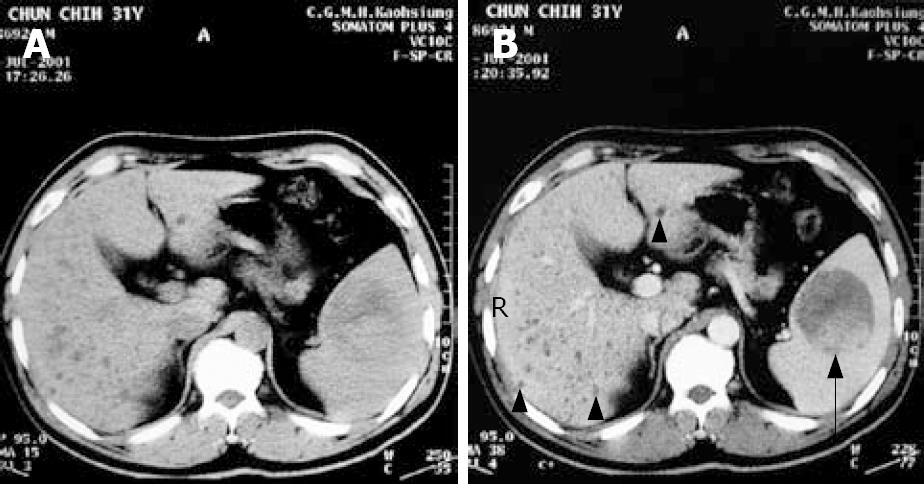
Figure 2 Abdominal CT.
A: Non-contrast CT showed a well-defined tumor over the spleen; B:Contrast CT showed partial enhancement of the tumor with high density in the dorsal portion of the tumor (arrow) and multiple diffuse low-attenuation nodules in liver parenchyma (arrowhead).
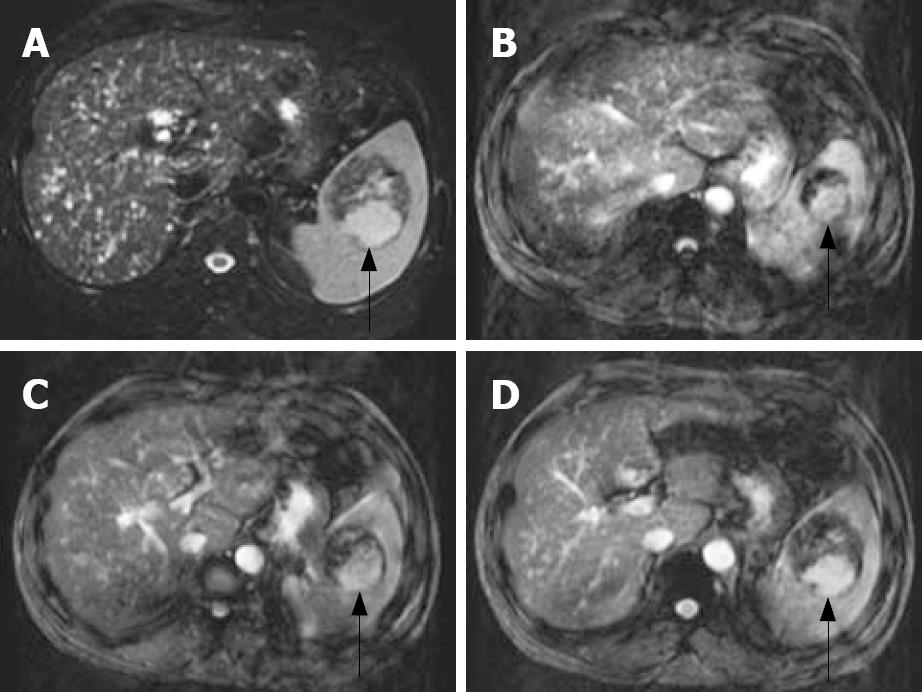
Figure 3 MRI.
A: In T2-weighted image, a well-circumscribed tumor (arrow) in the spleen, which showed partially dense intensity; B-D: In T1 contrast-enhancement dynamic study, peripheral nodule enhancement with gadolinium-contrast filling and pooling were noted in the tumor.
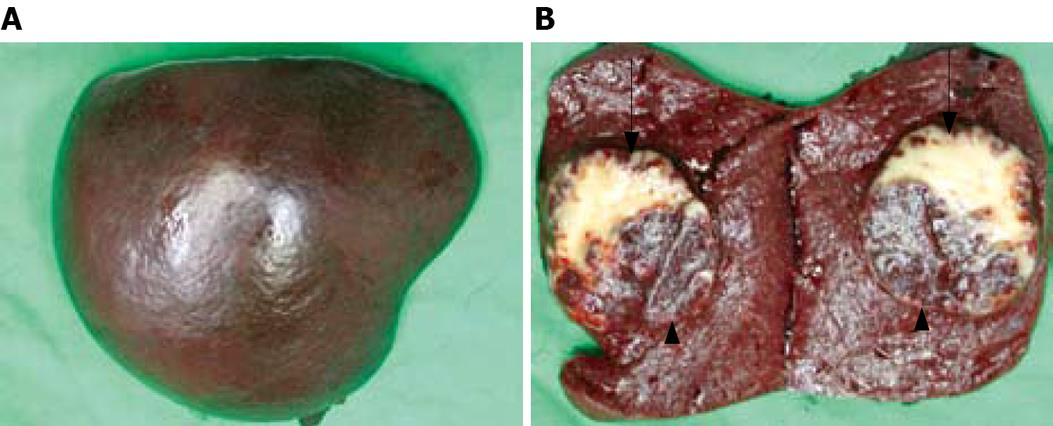
Figure 4 The specimen of spleen.
The removed spleen (A) was 11 cm × 8.5 cm × 6 cm in size. A well-circumscribed tumor (B), measuring 5.5 cm x 5 cm x 4 cm, over the central portion of the spleen was noted. There were two parts of different appearances comprising the tumor. The major part of the circumscribed lesion (arrow) showed yellowish appearance with some stippling red spots scattered over the cut surface. While the minor portion (arrowhead) located at dorsal aspect showed similar appearance as the normal spleen parenchyma.
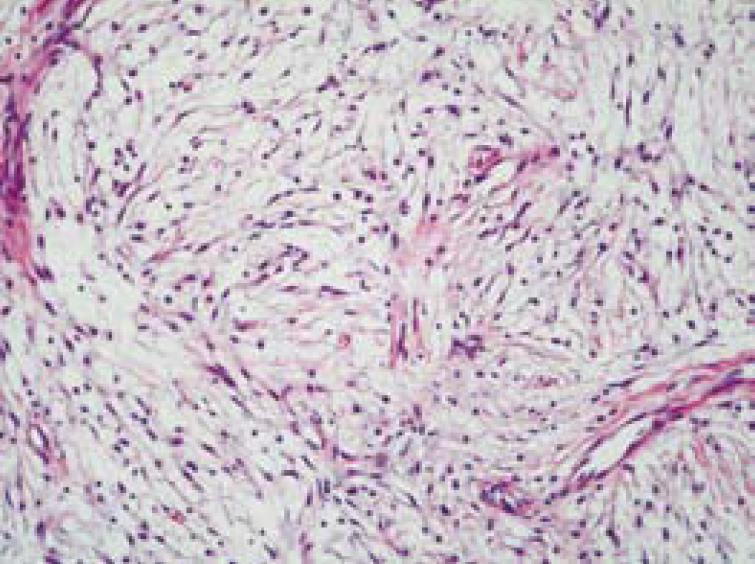
Figure 5 Histologic findings (hematoxylin and eosin stain, original magnification × 200).
The sections of the specimen are composed of fibrosis, focal sclerosis, plump spindle cells and vascular proliferation.
- Citation: Hsu CW, Lin CH, Yang TL, Chang HT. Splenic inflammatory pseudotumor mimicking angiosarcoma. World J Gastroenterol 2008; 14(41): 6421-6424
- URL: https://www.wjgnet.com/1007-9327/full/v14/i41/6421.htm
- DOI: https://dx.doi.org/10.3748/wjg.14.6421


