©2008 The WJG Press and Baishideng.
World J Gastroenterol. Nov 7, 2008; 14(41): 6306-6311
Published online Nov 7, 2008. doi: 10.3748/wjg.14.6306
Published online Nov 7, 2008. doi: 10.3748/wjg.14.6306
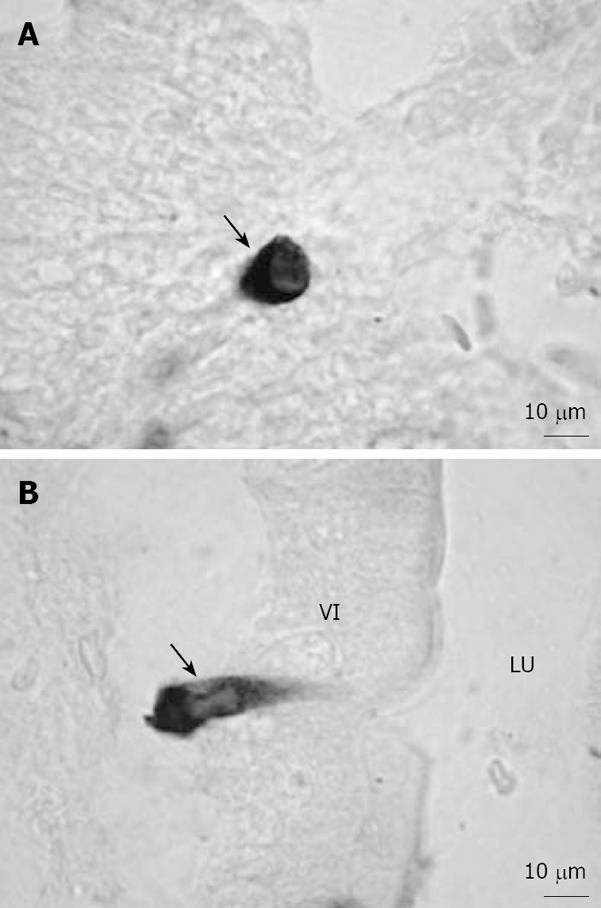
Figure 1 Representative microphotographs of ghrelin-ip cells in the rat gastrointestinal tract[16].
A: Closed-type ghrelin cells (arrow) were found in the crypt of the duodenum; B: Opened-type ghrelin cells (arrow) in contact with the lumen were found in the villi of the duodenum. Bar = 10 μm. VI: Villi; LU: Lumen.
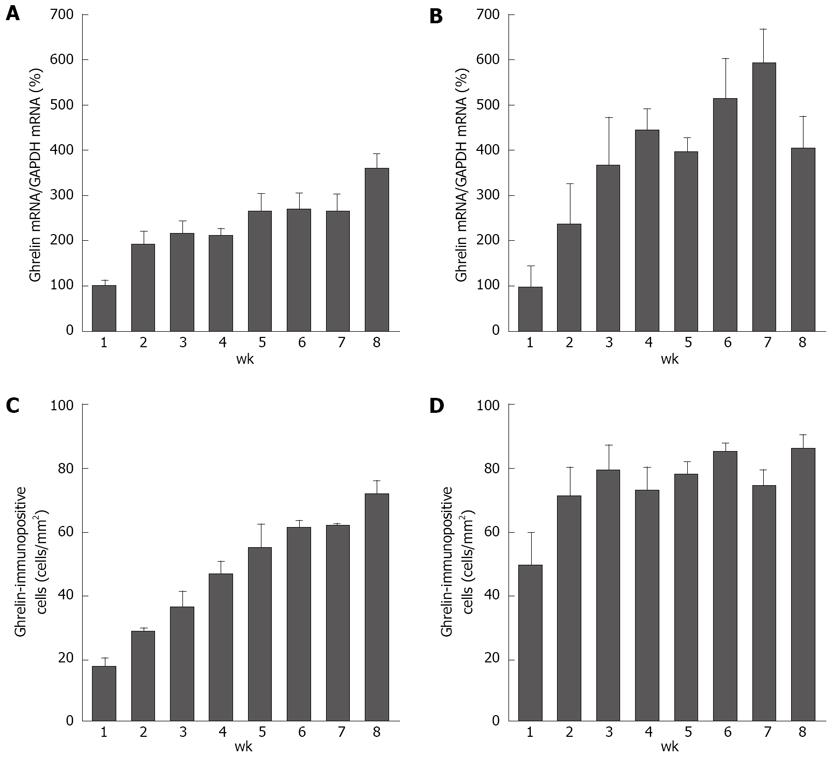
Figure 2 Changes in ghrelin mRNA levels and the densities of ghrelin-ip cells during the postneonatal period in the rat stomach[20].
The data in (A) and (B) are shown as the % of 1-wk-old (1 wk) rats (100%) and each bar represents the mean ± SE (n = 3). A: Ghrelin mRNA levels in the male stomach; B: Ghrelin mRNA levels in the female stomach; C: The densities of ghrelin-ip cells (cells/mm2) in the male stomach; D: The densities of ghrelin-ip cells (cells/mm2) in the female stomach.
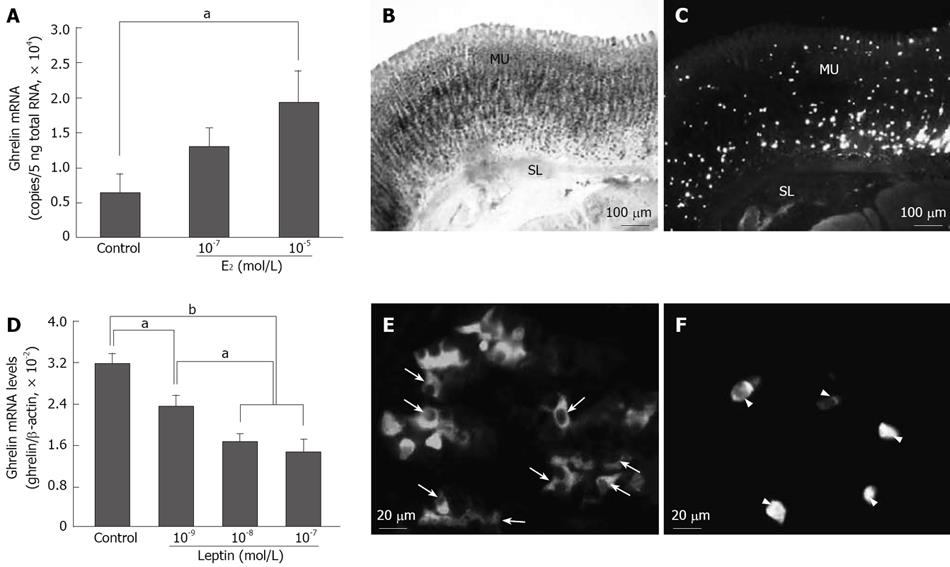
Figure 3 In vitro effects of estrogen and leptin on ghrelin mRNA expression and distributions of aromatase mRNA-expressing, leptin-ip and ghrelin-ip cells in the gastric mucosa[23,27].
A: Changes in ghrelin mRNA expression after estrogen treatment; B: Aromatase mRNA-expressing cells were found in the glandular body of the fundic gland; C: Ghrelin-ip cells were found sporadically throughout the gastric mucosa; D: Changes in ghrelin mRNA expression after leptin treatment. Ghrelin mRNA level is expressed relative to β-actin mRNA level; E: Leptin-ip cells (arrow) were found in the lower half of the fundic gland; F: Ghrelin-ip cells (arrowhead) were found in the gastric mucosa. (A, D) Data are presented as mean ± SE. n = 3-4/group. aP < 0.05; bP < 0.01. Bar = 100 μm (B, C) and 20 μm (E, F) respectively. MU: Mucosa; SL: Smooth muscle layer.
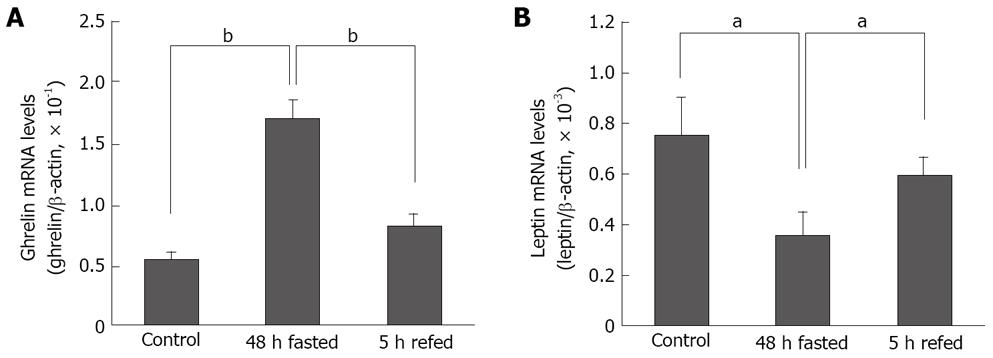
Figure 4 mRNA expression levels of gastric ghrelin and leptin under different feeding conditions[27].
(A) Effects of 48 h of fasting and 5 h of refeeding on gastric ghrelin expression; (B) Effects of 48 h of fasting and 5 h of refeeding on gastric leptin expression. Ghrelin and leptin mRNA levels are expressed relative to β-actin mRNA levels. Data are presented as mean ± SE. n = 3-4/group. aP < 0.05; bP < 0.01.
- Citation: Zhao Z, Sakai T. Characteristic features of ghrelin cells in the gastrointestinal tract and the regulation of stomach ghrelin expression and production. World J Gastroenterol 2008; 14(41): 6306-6311
- URL: https://www.wjgnet.com/1007-9327/full/v14/i41/6306.htm
- DOI: https://dx.doi.org/10.3748/wjg.14.6306


