Copyright
©2008 The WJG Press and Baishideng.
World J Gastroenterol. Jul 21, 2008; 14(27): 4309-4318
Published online Jul 21, 2008. doi: 10.3748/wjg.14.4309
Published online Jul 21, 2008. doi: 10.3748/wjg.14.4309
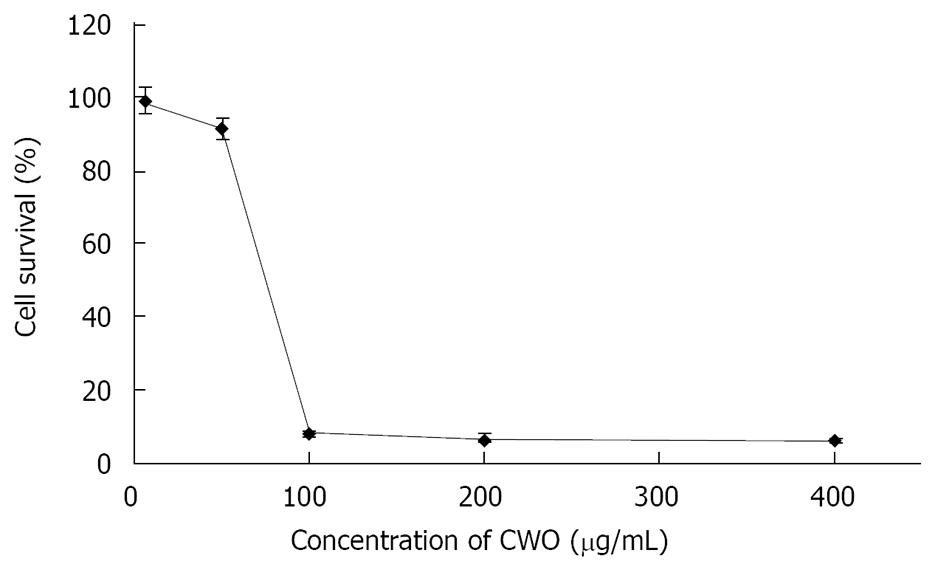
Figure 1 HepG2 cells were treated with the indicated concentrations of CWO for 48 h.
Cell growth was determined by the MTT assay and was directly proportional to the absorbance at a wavelength of 570 nm. Data are expressed as mean ± SD from three independent experiments.
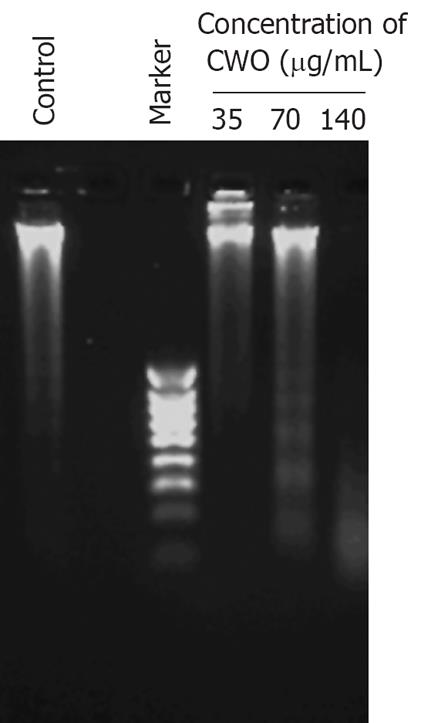
Figure 2 Agarose gel of electrophoresis of genomic DNA obtained from HepG2 cells treated with different concentrations of CWO for 72 h.
DNA fragmentation with a ladder pattern is a characteristic for apoptosis.
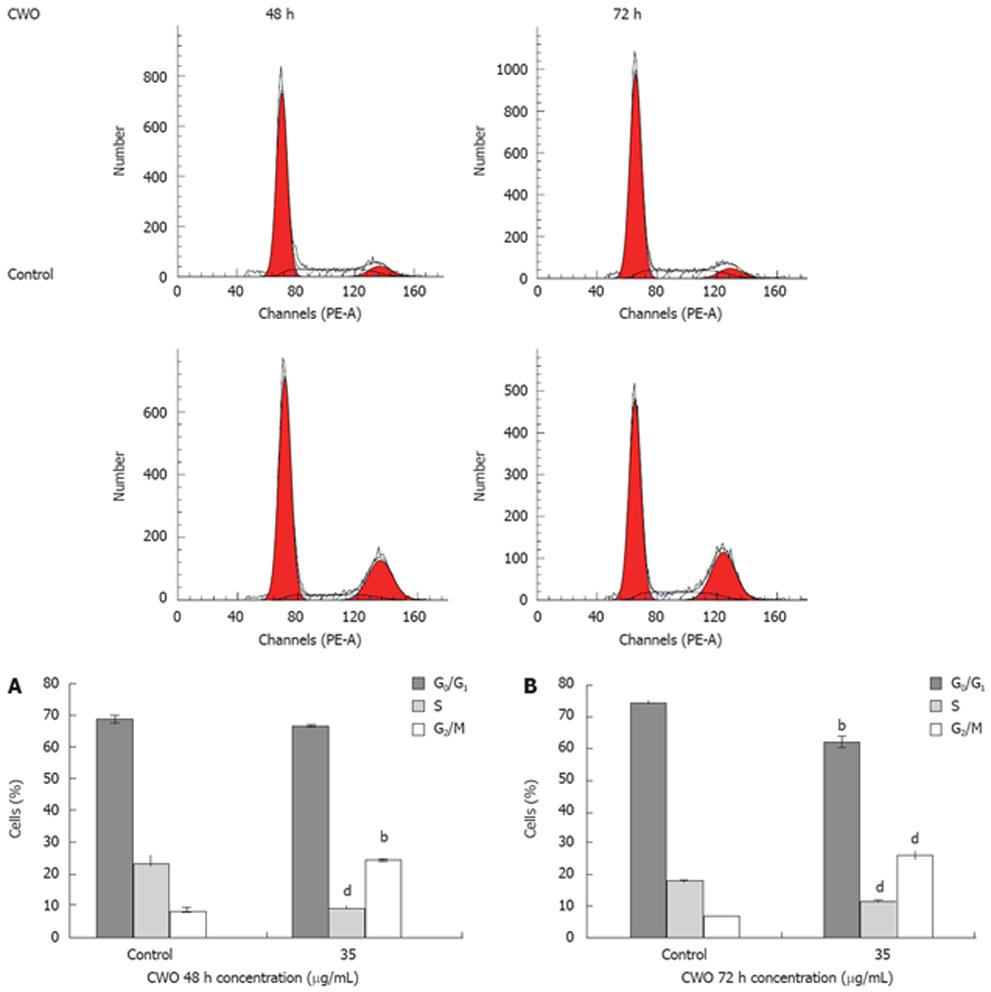
Figure 3 Effect of CWO on HepG2 cell cycle progression.
Flow cytometric analysis of propidium iodide-stained HepG2 cells treated with 35 &mgr;g/mL CWO for 48 h (A) and 72 h (B). The results of HepG2 cells treated with CWO were analyzed by Mod Fit LT 3.0. Data expressed as mean ± SD from three independent experiments. bP < 0.01, dP < 0.001 vs control.
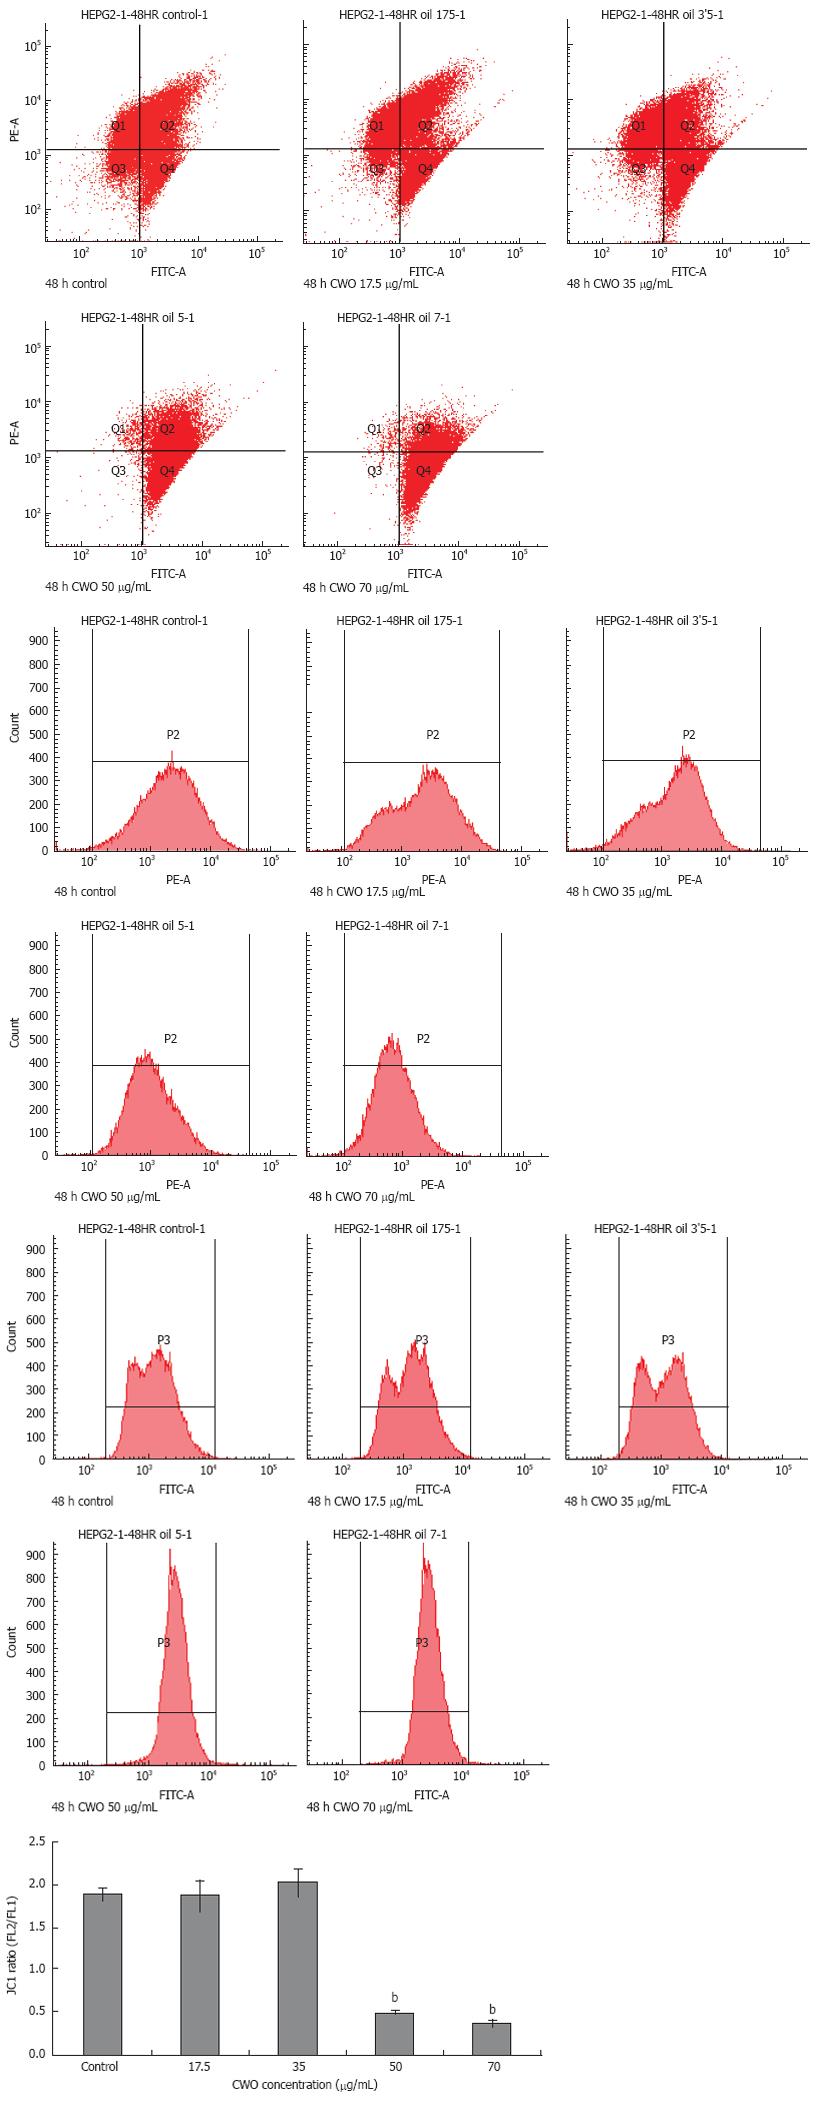
Figure 4 Analysis of change of ΔΨm in HepG2 cells.
HepG2 treated with 17.5, 35 , 50, and 70 &mgr;g/mL for 48 h, were stained with JC-1 probe. The cells were analyzed by FCM. Red and green fluorescence were measured by FL2 and FL1 channel, respectively. Red fluorescence indicates intact mitochondrial potential while green fluorescence indicates breakdown of mitochondrial potential. The ratio of intensity of FL2 to FL1 indicates the change of ΔΨm. Data expressed as mean ± SD from four independent experiments. bP < 0.001 vs control.
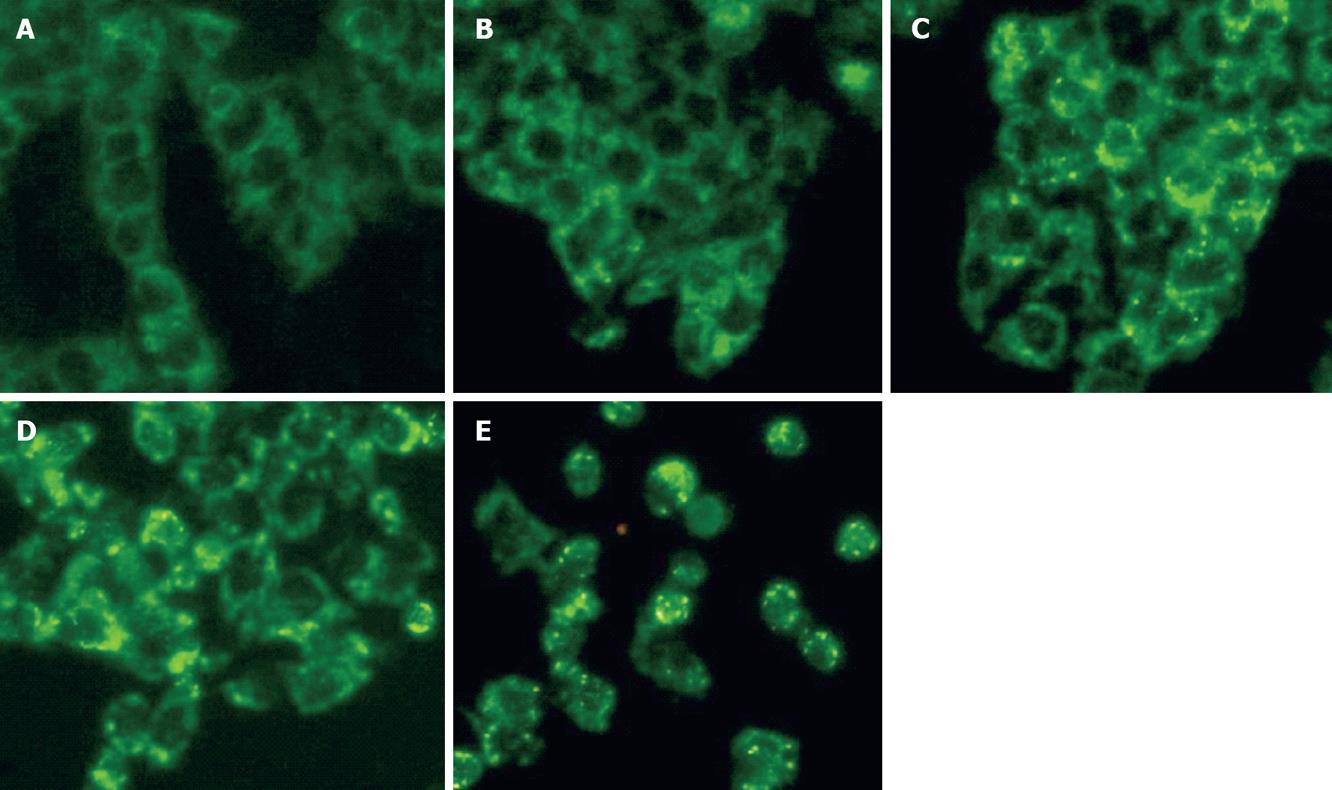
Figure 5 Cytochrome C release into the cytosol in CWO treated HepG2 cells for 12 h.
Cytochrome C immunofluorescence was observed with fluorescent microscope. A: Control; B: 17.5 &mgr;g/mL; C: 35 &mgr;g/mL; D: 70 mg/mL; E: 120 mg/mL. Fine punctate/granular stainings for cytochrome C are observed. Cytochrome C release also
increases the global cytosolic fluorescent signal. Similar results were obtained for 3 independent experiments (× 20).
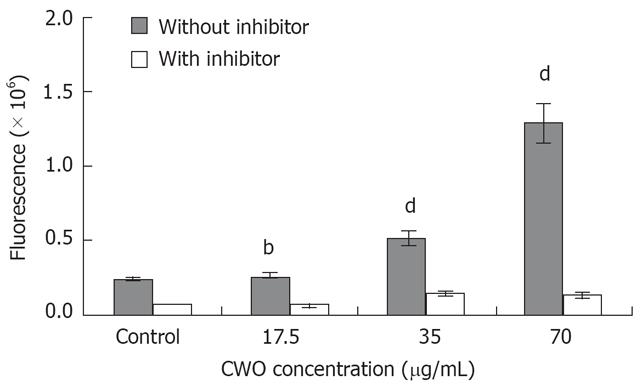
Figure 6 The fluorescence was increased in a dose-dependant manner after 24 h treatment with CWO.
Caspase-3 cleaves substrate Ac-DEVD-R110 to emit green fluorescence. Higher fluorescent intensity indicates higher caspase-3 enzymatic activity. Ac-DEVE-CHO inhibitor can inhibit caspase-3 enzymatic activity. Data are expressed as mean ± SD from three independent experiments. bP < 0.001, dP < 0.01 vs control.
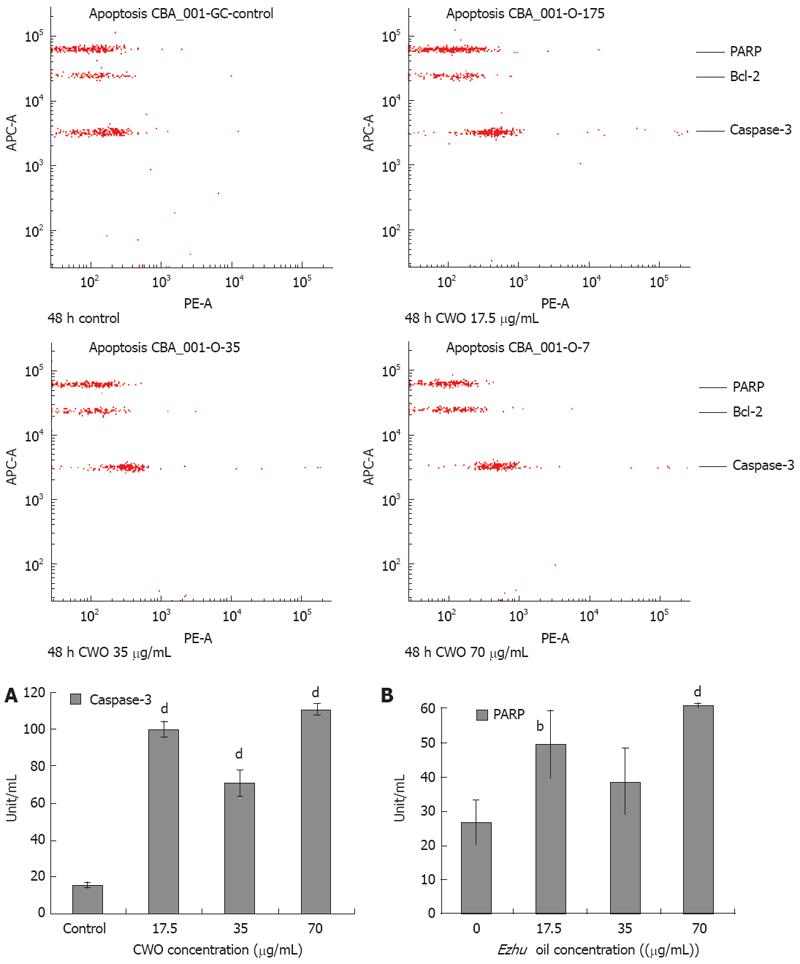
Figure 7 Protein expression levels of active caspase-3 and cleaved PARP in CWO-induced apoptosis.
HepG2 cells were treated with medium alone (control) or different concentration of CWO for 48 h. Cells of each sample were counted to 1.0 × 10⁶ and all the samples were normalized to final protein concentration in 0.2 &mgr;g/&mgr;L. It was detected with BDTM CBA Human Apoptosis Kit (BD, Franklin Lakes, USA) according to manufacturer instruction. The results were analyzed by FCAP Array V1.0. Active caspase-3 protein level in HepG2 was shown in (A) and the cleaved PARP protein level in HepG2 was shown in (B). The x-axis indicated the concentration of CWO while the y-axis indicated amount of proteins (unit per mL). Concentration of active caspase-3 and cleaved PARP in test samples were determined using the standard curve. Data expressed as mean ± SD from three independent experiments. bP < 0.01, dP < 0.001 vs control.
-
Citation: Xiao Y, Yang FQ, Li SP, Hu G, Lee SMY, Wang YT. Essential oil of
Curcuma wenyujin induces apoptosis in human hepatoma cells. World J Gastroenterol 2008; 14(27): 4309-4318 - URL: https://www.wjgnet.com/1007-9327/full/v14/i27/4309.htm
- DOI: https://dx.doi.org/10.3748/wjg.14.4309


