Copyright
©2008 The WJG Press and Baishideng.
World J Gastroenterol. Jul 14, 2008; 14(26): 4168-4178
Published online Jul 14, 2008. doi: 10.3748/wjg.14.4168
Published online Jul 14, 2008. doi: 10.3748/wjg.14.4168
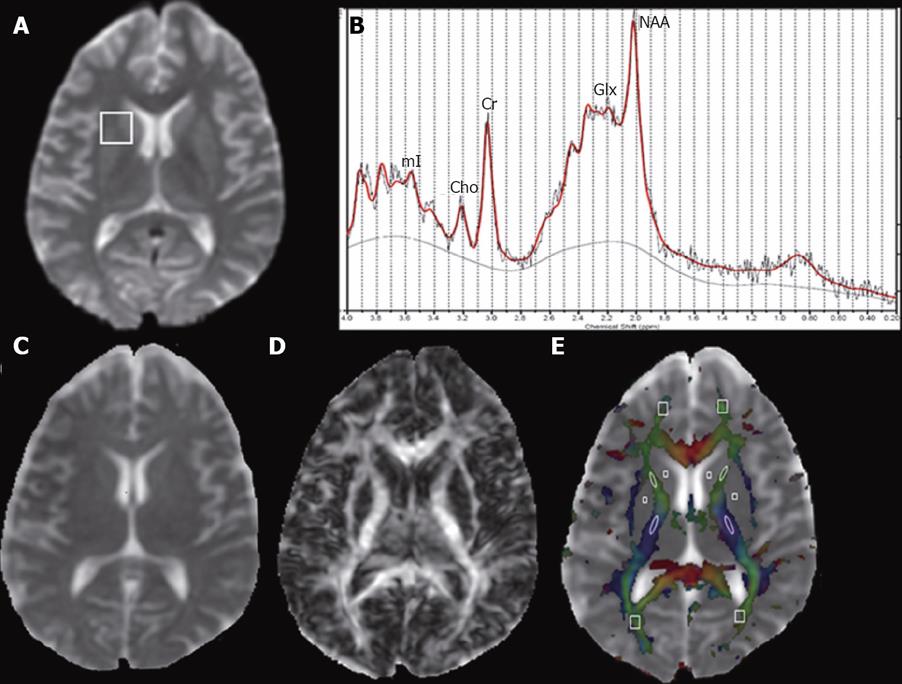
Figure 1 Conventional magnetic resonance imaging (MRI) and diffusion tensor imaging (DTI) were performed at three days after the onset of encephalopathy in a 29-year-old man with acute liver failure (ALF) before the mannitol administration.
A: Axial T2-weighted imaging at the level of third ventricle does not show any visible abnormality; B: Localized proton spectrum from 2 cm × 2 cm × 2 cm voxel placed on right parietal region (A) shows the metabolite ratios with respect to Cr (NAA/Cr = 1.35, Cho/Cr = 0.34, Gln/Cr = 2.57, Glx/Cr = 4.12, mI/Cr = 0.45); C: Mean diffusivity (MD) map, [anterior limb of internal capsule (ALIC) = 0.68, posterior limb of internal capsule (PLIC) = 0.65, caudate nuclei (CN) = 0.67, putamen (P) = 0.60, thalamus (TH) = 0.66, frontal white matter (FWM) = 0.66, occipital white matter (OWM) = 0.67, corpus callosum (CC) = 0.60, cingulum = 0.70, frontal cortex = 0.63, parietal cortex = 0.70, occipital cortex = 0.63]; D: Fractional anisotropy (FA) map, (ALIC = 0.32, PLIC = 0.34, CN = 0.09, putamen = 0.08, thalamus = 0.11, FWM = 0.33, OWM = 0.38, CC = 0.53, cingulum = 0.45, frontal cortex = 0.16, parietal cortex = 0.10, occipital cortex = 0.12). The cut off value for the color-coded FA for display is kept at 0.2 (E) above which the color-coded regions reflect the white matter only [red (right-left), green (anterior-posterior), and blue (superior-inferior)]. Cho: Choline; Cr: Creatine; Gln: Glutamine; Glx: Glutamine/glutamate; mI: Myoinositol; NAA: N-acetylaspartate.
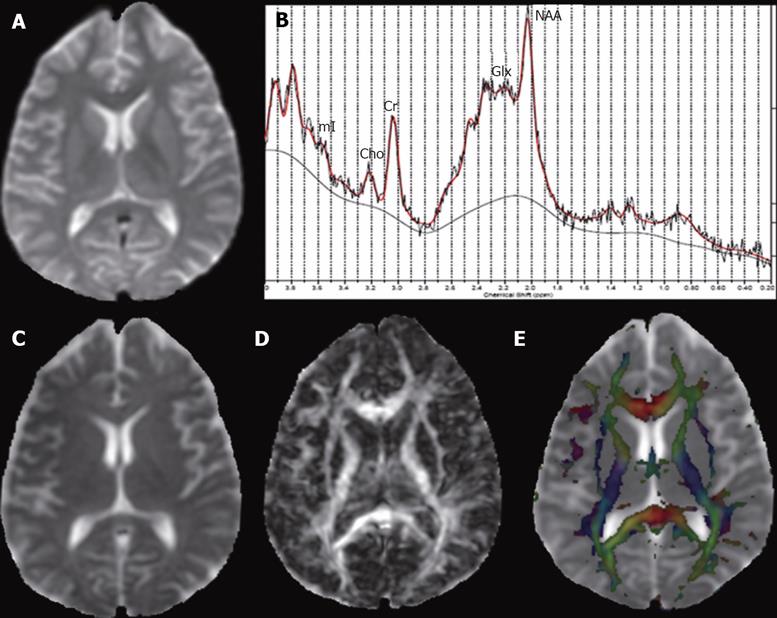
Figure 2 Repeat MRI and DTI were performed after 30 min of mannitol infusion on the same ALF patient as in Figure 1 to look for any mannitol effect on imaging.
In post-mannitol study, the effect of mannitol was quantified between 30-46 min. A: Axial T2-weighted image; B: Localized proton spectrum from the same region as in Figure 1A shows NAA/Cr = 1.83, Cho/Cr = 0.29, Gln/Cr = 2.60, Glx/Cr = 4.57, mI/Cr = 0.32; C: Mean diffusivity (MD) map, [anterior limb of internal capsule (ALIC) = 0.67, posterior limb of internal capsule (PLIC) = 0.70, caudate nuclei (CN) = 0.70, putamen (P) = 0.63, thalamus (TH) = 0.62, frontal white matter (FWM) = 0.66, occipital white matter (OWM) = 0.60, corpus callosum (CC) = 0.70, cingulum = 0.72, frontal cortex = 0.69, parietal cortex = 0.66, occipital cortex = 0.62]; D: Fractional anisotropy (FA) map, (ALIC = 0.32, PLIC = 0.34, CN = 0.08, putamen = 0.06, thalamus = 0.13, FWM = 0.30, OWM = 0.43, CC = 0.46, cingulum = 0.40, frontal cortex = 0.10, parietal cortex = 0.12, occipital cortex = 0.08) at the level of third ventricle. E: There is no significant change in the MD and FA values, and metabolite ratios mentioned here compared to what is mentioned in Figure 1. Cho: Choline; Cr: Creatine; Gln: Glutamine; Glx: Glutamine/glutamate; mI: Myoinositol; NAA: N-acetylaspartate.
-
Citation: Saraswat VA, Saksena S, Nath K, Mandal P, Singh J, Thomas MA, Rathore RS, Gupta RK. Evaluation of mannitol effect in patients with acute hepatic failure and acute-on-chronic liver failure using conventional MRI, diffusion tensor imaging and
in-vivo proton MR spectroscopy. World J Gastroenterol 2008; 14(26): 4168-4178 - URL: https://www.wjgnet.com/1007-9327/full/v14/i26/4168.htm
- DOI: https://dx.doi.org/10.3748/wjg.14.4168


