Copyright
©2008 The WJG Press and Baishideng.
World J Gastroenterol. Jun 28, 2008; 14(24): 3891-3896
Published online Jun 28, 2008. doi: 10.3748/wjg.14.3891
Published online Jun 28, 2008. doi: 10.3748/wjg.14.3891
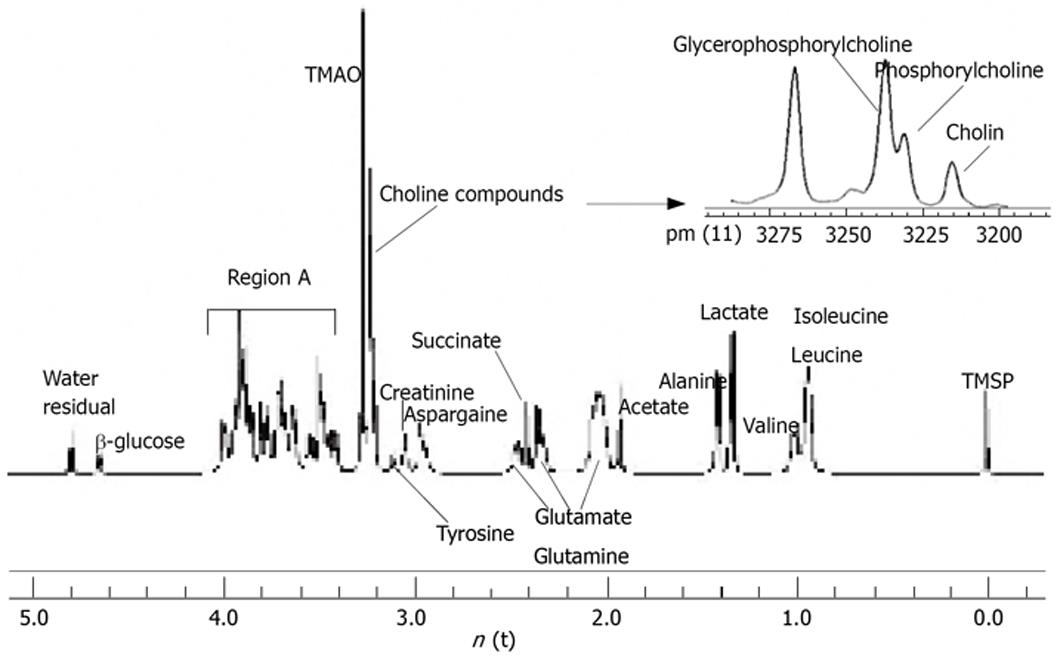
Figure 1 High-resolution proton spectra of liver tissue of a rat in control group and internal standard (TMSP).
The field 0.0-5.0 ppm is shown.
Figure 2 Light microscopy of HE stained livers.
A: Specimen from control group (× 100); B: Specimen from treatment group (× 100); C: Specimen from control group (× 400); D: Specimen from treatment group (× 400). Arrowhead indicates vacuolated hepatocytes.
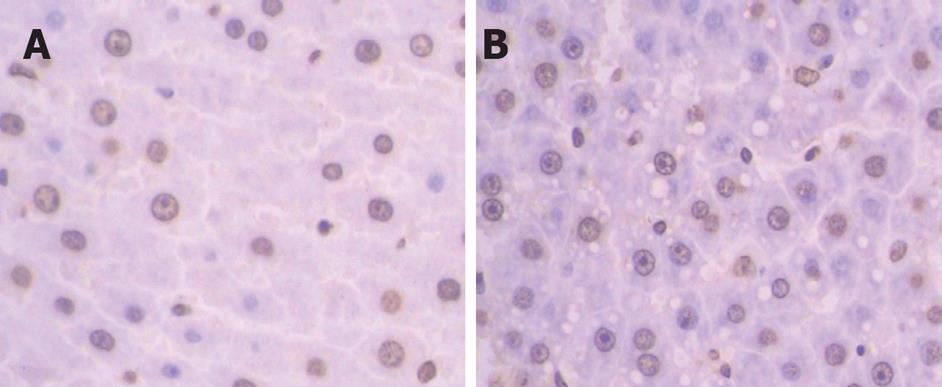
Figure 3 The brown hepatocytes showing the cell apoptosis (TUNEL staining).
A: Specimen from control group (× 400); B: Specimen from treatment group (× 400).
-
Citation: Cao Z, Wu LP, Li YX, Guo YB, Chen YW, Wu RH. Change of choline compounds in sodium selenite-induced apoptosis of rats used as quantitative analysis by
in vitro 9.4T MR spectroscopy. World J Gastroenterol 2008; 14(24): 3891-3896 - URL: https://www.wjgnet.com/1007-9327/full/v14/i24/3891.htm
- DOI: https://dx.doi.org/10.3748/wjg.14.3891


