Copyright
©2008 The WJG Press and Baishideng.
World J Gastroenterol. Jun 28, 2008; 14(24): 3829-3840
Published online Jun 28, 2008. doi: 10.3748/wjg.14.3829
Published online Jun 28, 2008. doi: 10.3748/wjg.14.3829
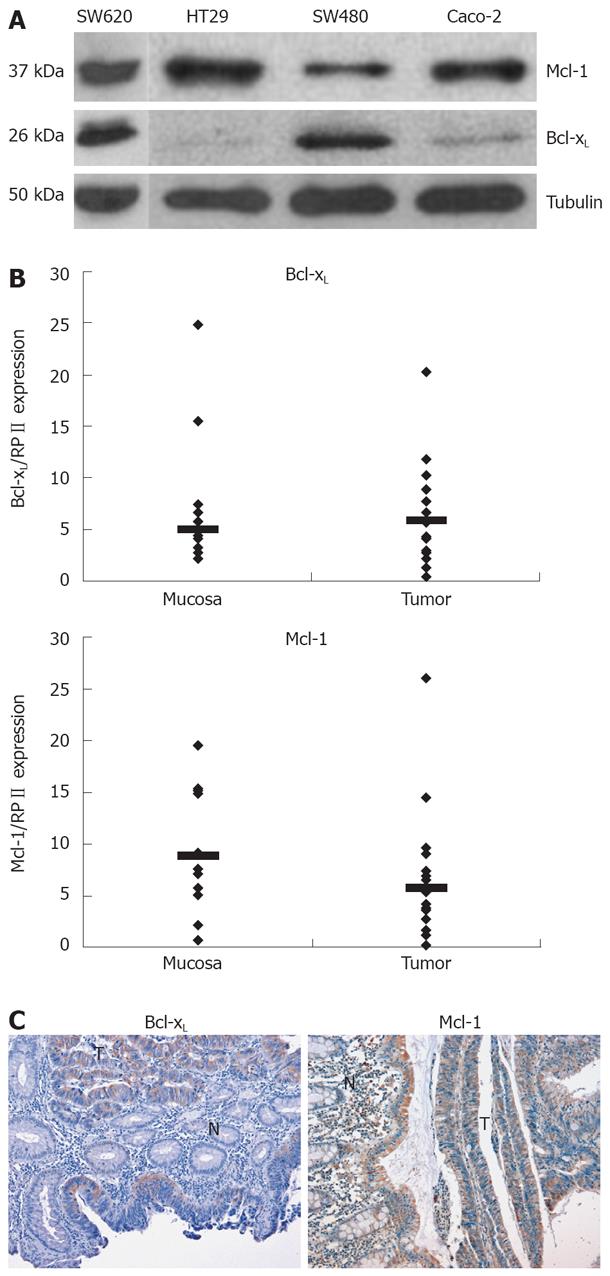
Figure 1 Mcl-1 and Bcl-xL expression in CRC.
A: The CRC cell lines, HT29, SW620, SW480, and Caco-2, were analyzed for the basal expression of the Bcl-2 family members Bcl-xL and Mcl-1. Whole cell lysates were prepared, separated, and immunoblotted with antibodies against Bcl-xL, Mcl-1 and α-tubulin; B: CRC tissues and normal colorectal tissues were tested for mRNA expression (n = 9 patients). mRNA expression levels of Bcl-xL, Mcl-1 and RPII were measured in all tissue samples by quantitative real-time PCR. mRNA expression levels of Bcl-xL or Mcl-1 were normalized to RPIIin each sample. Each PCR reaction was run in triplicates. Median is added; C: Immunohistochemical analysis of human CRC tissues was performed as described in the Methods section. All sections included carcinoma as well as normal epithelial tissues to directly compare Bcl-xL as well as Mcl-1 expression in neoplastic and non-malignant tissues. Representative analysis of immunoperoxidase detection of Bcl-xL and Mcl-1 in paraffin embedded carcinoma tissue (T) and adjacent non-tumor tissue (N) is presented.
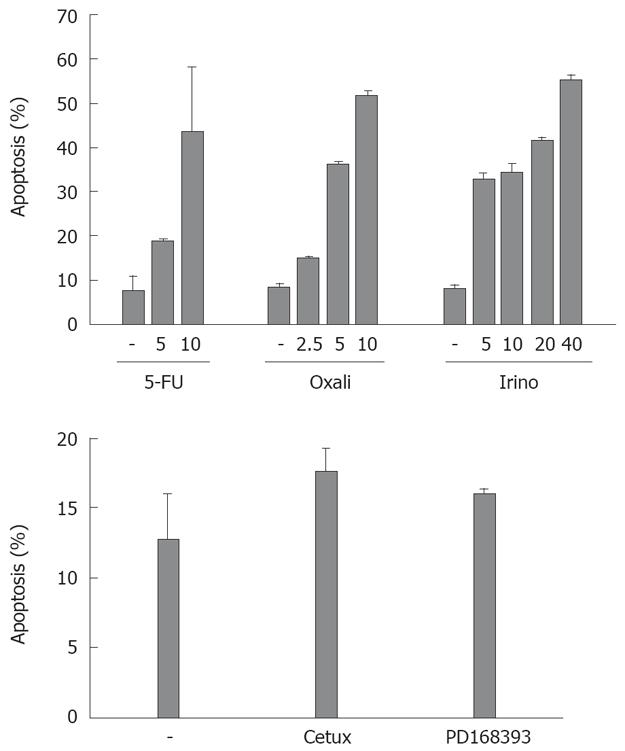
Figure 2 Drug-induced apoptosis in CRC cells.
SW480 cells were treated with the chemotherapeutic agents 5-FU, oxalipatin (“oxali”) and irinotecan (“irino”) for 48 h (concentrations as indicated, upper panel). In addition, cells were treated with the EGFR1 antibody cetuximab (“cetux”, 20 &mgr;g/mL) or the EGFR1 tyrosine kinase inhibitor PD168393 (7 &mgr;mol/L, lower panel) in FCS reduced medium. Cells were then harvested and analyzed for apoptosis induction by flow cytometry. Assays were performed in triplicates. Values are mean ± SD.
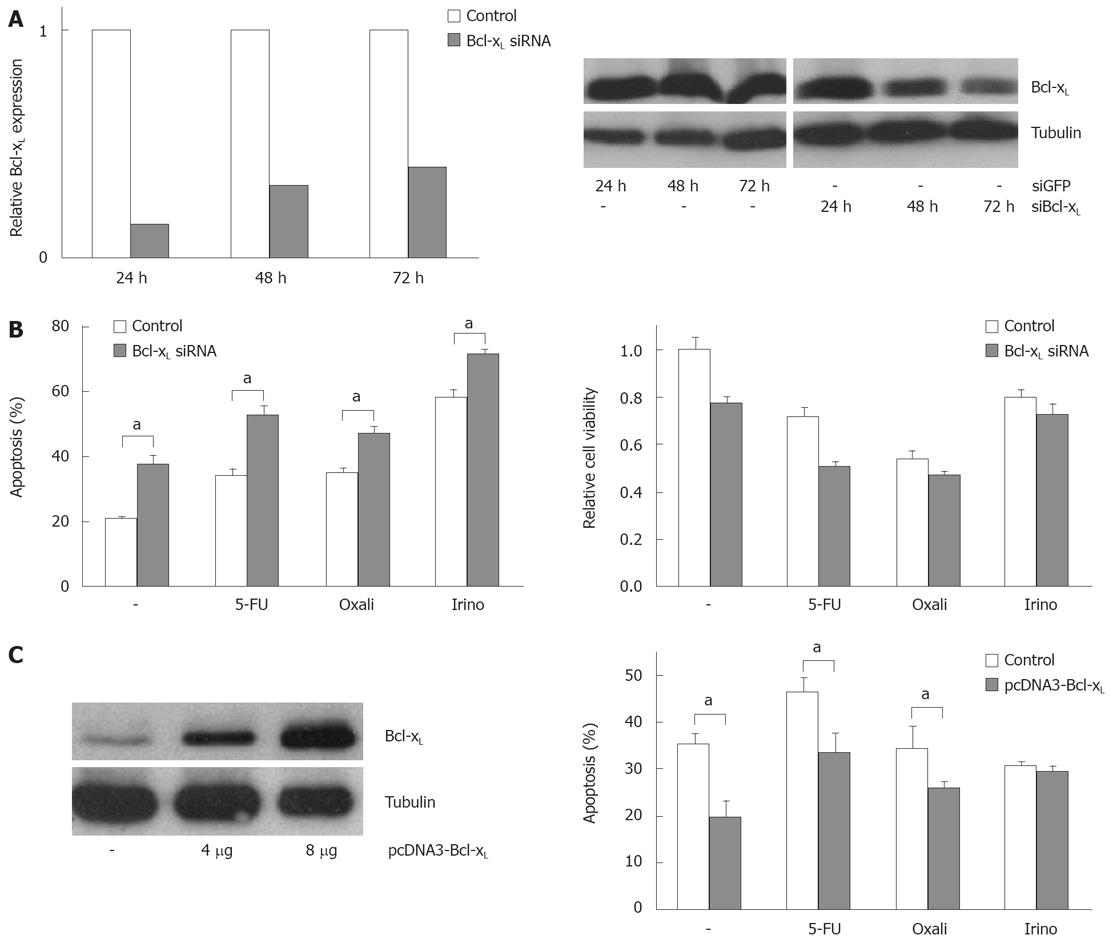
Figure 3 Modulation of Bcl-xL expression alters chemotherapeutic drug-induced apoptosis.
A: SW480 cells were transfected with siRNA specific for Bcl-xL or transfected with siRNA specific for GFP as control (20 nmol/L). After the indicated time post transfection, total RNA was extracted and analyzed for Bcl-xL expression by quantitative real-time PCR (left panel). Relative expression was calculated as described in the materials and methods section. In addition, after the indicated time post transfection, cells were lyzed and analyzed for Bcl-xL expression by Western blot (right panel). α-Tubulin expression was used to control equal loading; B: SW480 cells were transfected with siRNA specific for Bcl-xL or transfected with siRNA specific for GFP as control. 24 h post transfection, cells were treated with 5-FU (10 &mgr;g/mL), oxaliplatin (16 &mgr;g/mL) and irinotecan (60 &mgr;g/mL) for further 24 h. Cells were then harvested and analyzed for apoptosis induction (left panel). In addition, cell viability was measured by MTT assay and is shown relative to mock treated controls (right panel); C: SW480 cells were transfected with pcDNA3 Bcl-xL or pcDNA3 empty vector as control. 24 h post transfection, cells were analyzed for Bcl-xL expression using Western blotting (left panel). In addition, 24 h post transfection, cells were treated with 5-FU (15 &mgr;g/mL), oxaliplatin (10 &mgr;g/mL) and irinotecan (40 &mgr;g/mL) for further 24 h. Cells were then harvested and analyzed for apoptosis induction by flow cytometry. (B) and (C) assays were performed in triplicates. Values are means ± SD, aP < 0.05.
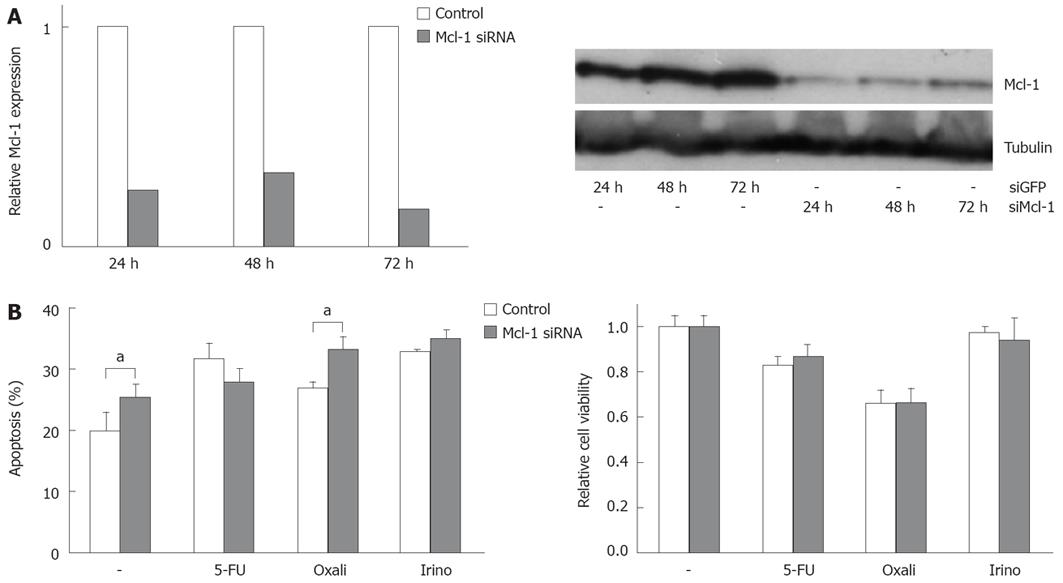
Figure 4 Modulation of Mcl-1 expression alters chemotherapeutic drug-induced apoptosis.
A: SW480 cells were transfected with siRNA specific for Mcl-1, or transfected with siRNA specific for GFP as control (20 nmol/L). After the indicated time post transfection, total RNA was extracted and analyzed for Mcl-1 expression by quantitative real-time PCR (left panel). Relative expression was calculated as described in the materials and methods section. In addition, after the indicated time post transfection, cells were lyzed and analyzed for Mcl-1 expression by Western blot (right panel). α-Tubulin expression was used to control equal loading; B: SW480 cells were transfected with siRNA specific for Mcl-1 or transfected with control siRNA. 24 h post transfection cells were treated with 5-FU (10 &mgr;g/mL), oxaliplatin (16 &mgr;g/mL) and irinotecan (60 &mgr;g/mL) for further 24 h. Apoptosis induction was measured by flow cytometry (left panel) and MTT assay (right panel). Values are mean ± SD, aP < 0.05.
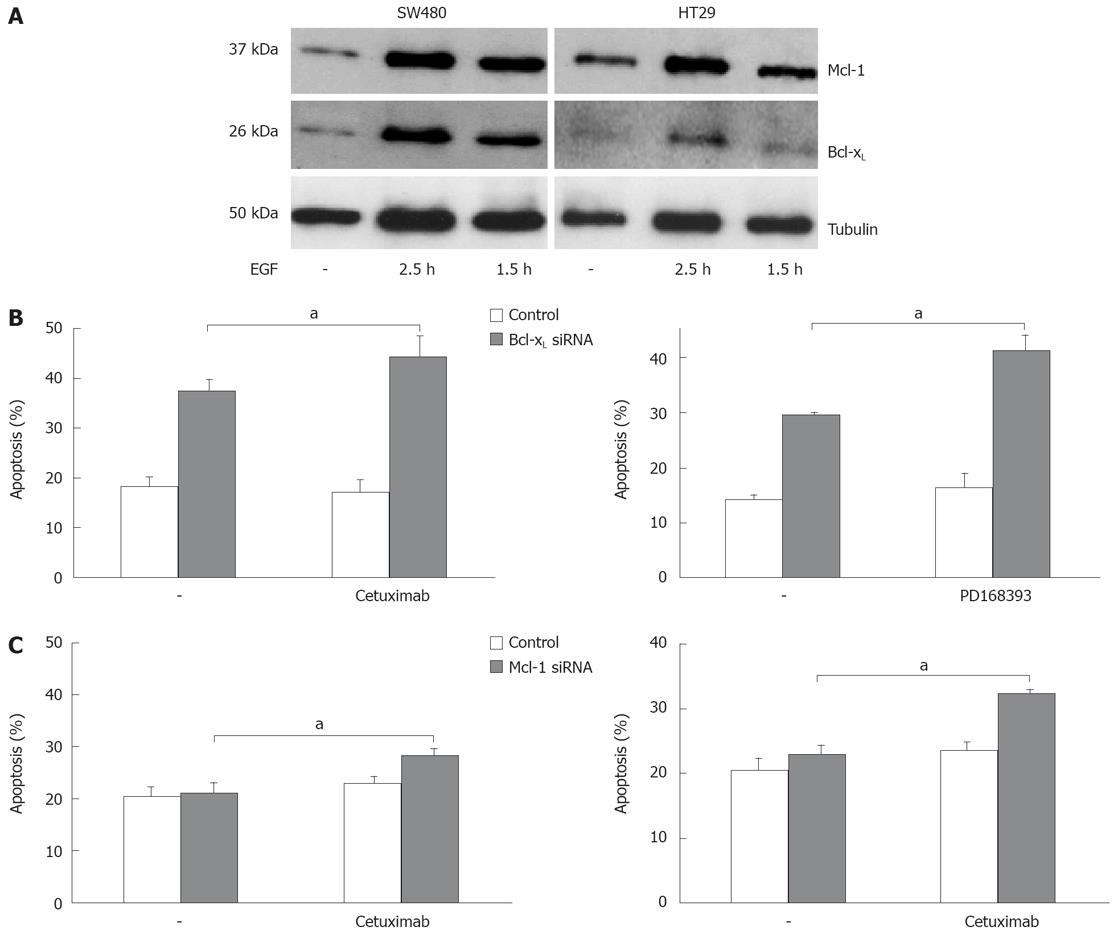
Figure 5 Bcl-xL and Mcl-1 knock down enhances apoptosis induction after EGFR1 inhibition.
A: SW480 and HT29 cells were treated with EGF (100 ng/mL) for the time indicated. Whole cell lysates were prepared, separated, and immunoblotted with antibodies against Bcl-xL, Mcl-1 and α-tubulin; B: SW480 cells were transfected with siRNA specific for Bcl-xL (upper panel), or Mcl-1 (lower panel), respectively, or transfected with siRNA specific for GFP as control. 24 h post transfection cells were treated with cetuximab (100 &mgr;g/mL) or PD168393 (0.7 &mgr;mol/L) for further 24 h. Cells were then harvested and analyzed for apoptosis induction by flow cytometry. Assays were performed in triplicates and are representative for at least two independent experiments. Values are means ± SD, aP < 0.05.
Figure 6 TRAIL- and CD95-induced apoptosis after modulation of Mcl-1 and Bcl-xL expression.
A: SW480 or SW620 cells were transfected with siRNA specific for Bcl-xL or GFP as control. 24 h post transfection cells were treated with TRAIL (0.1 &mgr;g/mL) for further 24 h. Cells were then harvested and analyzed for apoptosis induction by flow cytometry; B: SW480 cells were transfected with siRNA specific for Mcl-1 or GFP as control. 24 h post transfection cells were treated with TRAIL (0.01 &mgr;g/mL) for further 24 h. Cells were then harvested and analyzed for apoptosis induction by flow cytometry; C: SW480 cells were transfected with pcDNA3 Bcl-xL or pcDNA3 empty vector as control. 24 h post transfection, cells were treated with TRAIL (0.1 &mgr;g/mL) for further 12 h. Cells were then harvested and analyzed for apoptosis induction by flow cytometry; D: SW480 cells were transfected with siRNA specific for Mcl-1 (left panel) or Bcl-xL (right panel) or with control siRNA. 24 h post transfection cells were treated with anti-APO-1 (0.1 &mgr;g/mL) for further 24 h. Cells were then harvested and analyzed for apoptosis induction by flow cytometry. All assays were performed in triplicates and are representative for at least three independent experiments. Values are mean ± SD, aP < 0.05.
- Citation: Schulze-Bergkamen H, Ehrenberg R, Hickmann L, Vick B, Urbanik T, Schimanski CC, Berger MR, Schad A, Weber A, Heeger S, Galle PR, Moehler M. Bcl-xL and Myeloid cell leukaemia-1 contribute to apoptosis resistance of colorectal cancer cells. World J Gastroenterol 2008; 14(24): 3829-3840
- URL: https://www.wjgnet.com/1007-9327/full/v14/i24/3829.htm
- DOI: https://dx.doi.org/10.3748/wjg.14.3829


