©2008 The WJG Press and Baishideng.
World J Gastroenterol. Jun 21, 2008; 14(23): 3693-3709
Published online Jun 21, 2008. doi: 10.3748/wjg.14.3693
Published online Jun 21, 2008. doi: 10.3748/wjg.14.3693
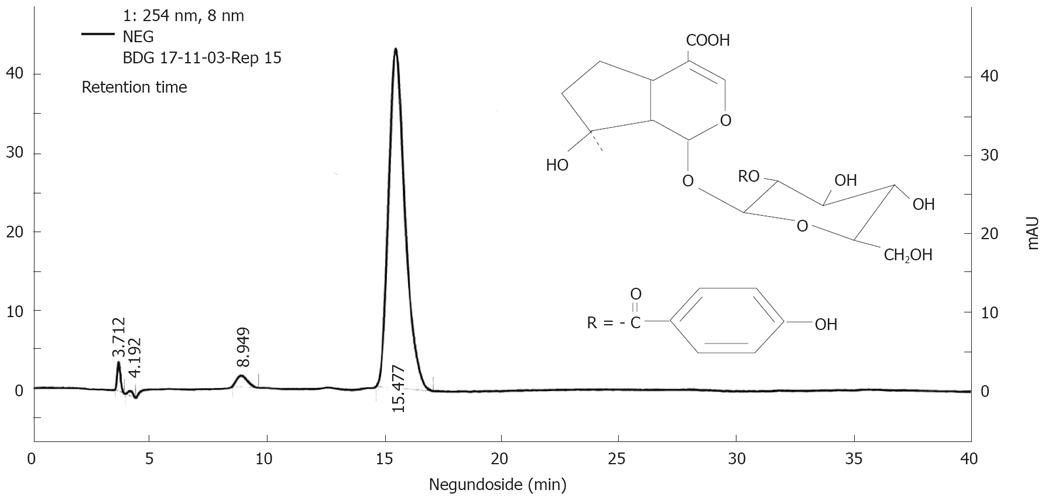
Figure 1 Finger print profile and chemical structure of NG.
The HPLC profile of NG was performed by employing Shimadzu HPLC system consisting of a diode array detector and C18 column (5 &mgr;m, 250 mm x 4.0 mm I.D.) by UV detection at 254 nm. NG was resolved on a mobile phase consisting of methanol: 2% acetonitrile (30:70) and delivered at a flow rate of 0.6 mL/min. The chromatogram is representative of one of three independent analyses.
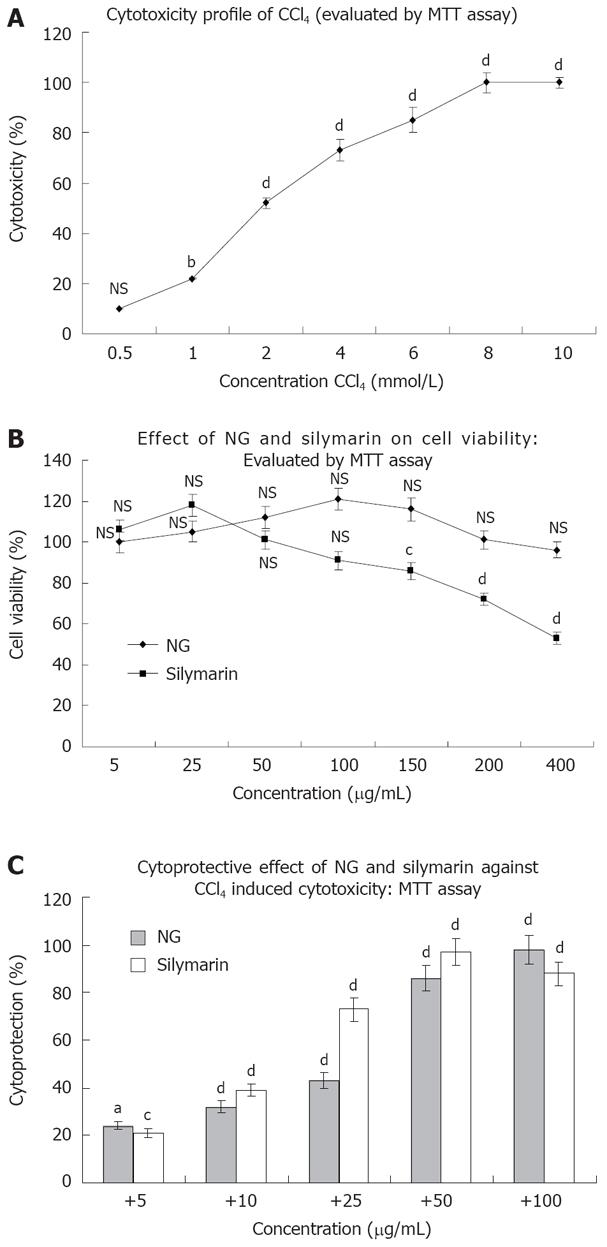
Figure 2 Cytotoxicity profile of CCl4 and protective effect of NG and silymarin on CCl4-induced inhibition of cellular proliferation in HuH-7 cells.
For cell proliferation assay, HuH-7 cells grown in 24-well culture plate were incubated with indicated concentrations of test materials. Cell proliferation was assessed by MTT reduction assay. A, B: Represents inhibition of cell proliferation by CCl4 and test materials (NG and silymarin); C: Represents protection of NG and silymarin, against CCl4 induced inhibition of cell proliferation. HuH-7 cells were treated with various concentrations of NG and silymarin (5 to 100 mg/L) 1 h before treatment with CCl4 for 24 h and the cell proliferation was determined by MTT reduction assay. Control wells received medium containing DMSO (< 0.2 mL/L). The % cell cytoxicity, % viability and % cytoprotection was calculated as, % Cytotoxicity = (Control - Test)/Control x 100, % Cell viability = % Cytotoxicity - 100, % Cytoprotection = 100 - (Treated - Control)/(CCl4 - Control) x 100. Data are mean ± SD (n = 8) and representative of one of three similar experiments and statistically significant P values: bP < 0.01; dP < 0.001; aP < 0.02; cP < 0.05; NS: Non-significant, CCl4 treated vs control cells; CCl4 + LIV-1/silymarin vs CCl4 treated cells.
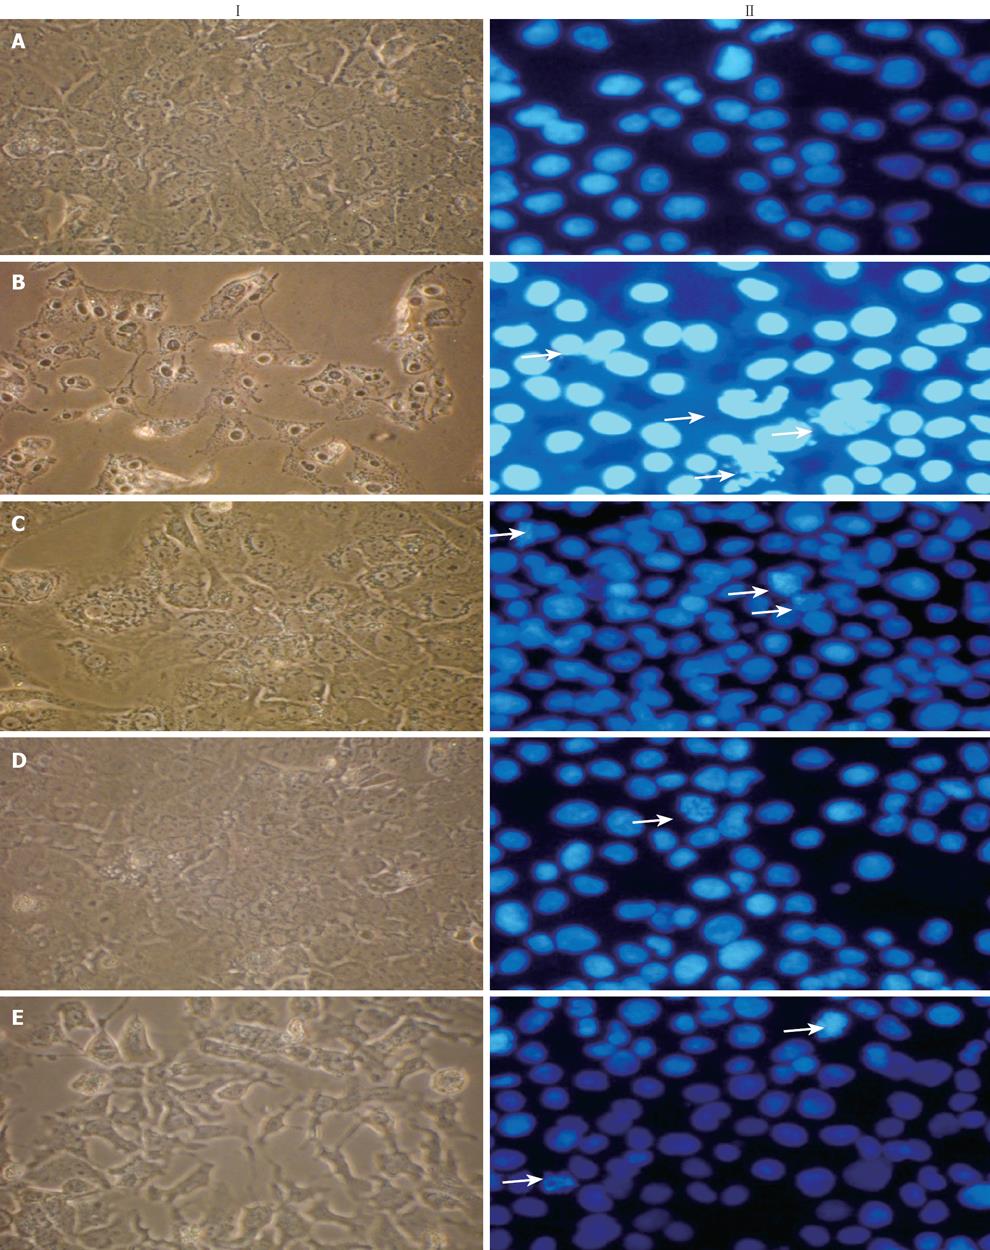
Figure 3 Effect of NG and silymarin against CCl4-induced altered cellular and nuclear morphology of HuH-7 cells.
NG and silymarin rescued CCl4-induced cellular (I) and nuclear morphological (II) changes. Cellular morphology was observed by normal phase contrast microscopy, while as nuclear morphology was evaluated by Hoechst 33258 staining of HuH-7 cells and observed under fluorescence microscopy as described in Materials and Methods. These methods detected influences of CCl4 on cellular and nuclear changes. A: Untreated control cells show normal cellular characteristics and rounded nuclei; B: Cells treated with CCl4 (2 mmol/L) for 24 h show altered membrane structure and condensed chromatin/nuclei, apoptotic (arrows) and scattered apoptotic bodies; C: Cells incubated with NG (30 mg/L); D:
Cells incubated with NG (100 mg/L); E: Cells incubated with silymarin (50 mg/L), 1 h before the treatment with CCl4 showed protection against CCl4-mediated cellular and nuclear alterations.
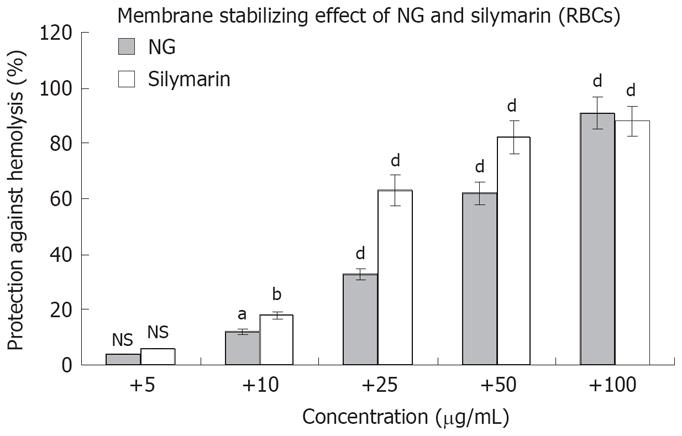
Figure 4 Membrane stabilizing effect of NG and silymarin on human RBCs.
RBC suspensions were pre-incubated with or without (control) test materials and triton (1 g/L) in phosphate buffered saline as described in Materials and Methods section. Data are mean ± SD (n = 3) and representative of one of three similar experiments and statistically significant P values: bP < 0.01; aP < 0.05; dP < 0.001; NS = Non-significant. Triton treated vs control cells; triton + NG/silymarin vs triton treated cells.
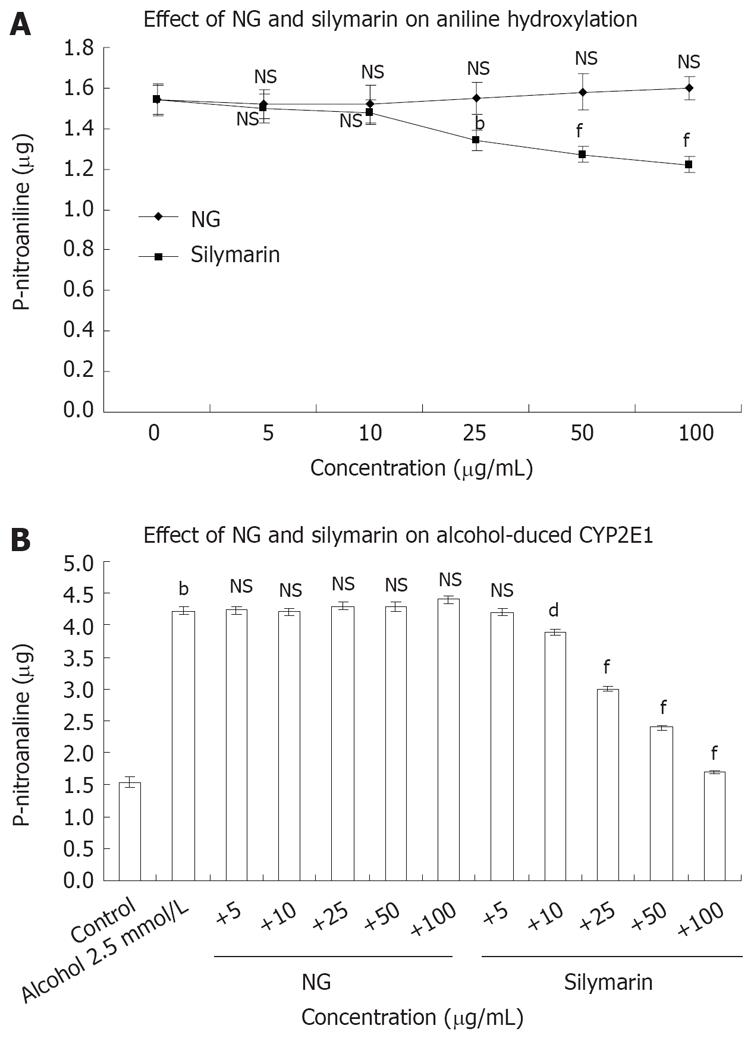
Figure 5 Effect of NG and silymarin in vitro on CYP2E1 catalytic activity.
A: Rat liver microsomes were incubated in the absence or presence of different concentrations (5 to 100 mg/L) of test materials. CYP2E1 activity was assayed by following the hydroxylation of aniline hydrochloride in presence of cumene hydroperoxide as described in Materials and Methods section; B: Concentration dependent protection by NG and silymarin against alcohol (2.5 mmol/L)-induced aniline hydroxylase levels in rat liver microsomes. The microsomes were pre-incubated with medium containing various concentrations (5 to 100 mg/L) of test materials for 5 min before addition of alcohol and aniline hydroxylase levels were determined. Data are expressed as mean ± SEM and are from a representative experiments repeated twice and conducted in triplicate. P values: bP < 0.001 vs the corresponding alcohol-treated microsomes; dP < 0.001 and fP < 0.001 vs alcohol-treated cells in presence of test materials; NS: Non-significant.
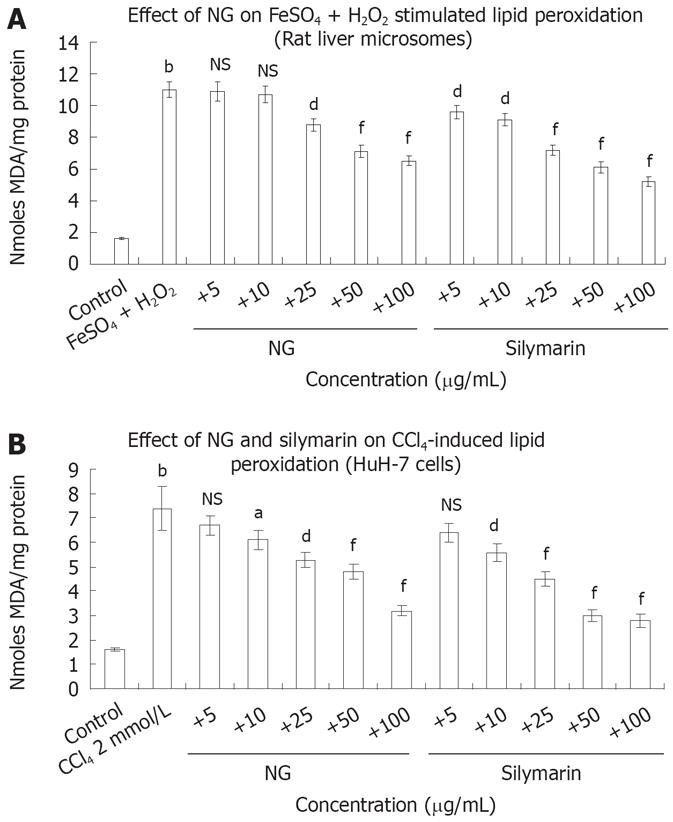
Figure 6 Protective effect of NG and silymarin against stimulated lipid peroxidation.
A: Anti-lipid peroxidative effect of NG and silymarin in vitro. Liver microsomes (1 mg protein/mL, 0.15 mol/L NaCl, pH 7.0) were incubated for 20 min at 37°C in the absence (control) and presence of 100 mmol/L FeSO4 +/50 mmol/L H2O2 (stimulated). In identically set-up Fe2+/H2O2-stimulated incubations, NG and silymarin (20 mg/L to 100 mg/L, in 30% DMSO) were added (test C). Control incubations received vehicle only; B: HuH-7 cells were pre-incubated for 1 h with medium containing test materials (NG and silymarin) at different concentrations (5 mg/L to 100 mg/L). The cells were further incubated in absence or presence of 2 mmol/L CCl4 (stimulated) for further 24 h. The cells were harvested by scraping and assayed for the production of MDA using TBARS assay, as described under materials and methods section. Reaction was terminated by the addition of 2.0 mL TCA-TBA reagent (15% TCA, 0.375% TBA in 5mol/L HCl) and LPO content determined as nmol MDA formed/mg protein. Data are expressed as mean ± SD and are from representative experiments repeated twice and conducted in triplicate. Statistical significance, bP < 0.01 vs the untreated control. dP < 0.01; aP < 0.05; fP < 0.001 and NS: Non-significant vs stimulated (FeSO4 + H2O2 and CCl4 treatments).
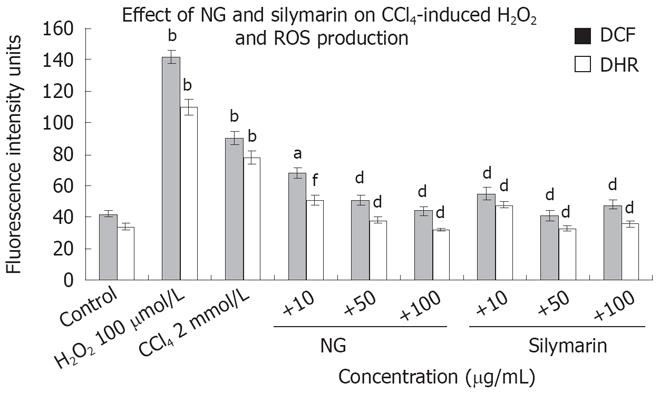
Figure 7 Effect of NG and silymarin on CCl4-induced ROS production.
HuH-7 cells were pre-incubated for 1 h with medium containing test materials (NG and silymarin) at different concentrations (10 to 100 mg/L). The cells were kept for further incubation in absence or presence of 2 mmol/L CCl4 (stimulated). After 24 h of incubation maintaining the specific treatments, the cells were incubated with serum-free medium containing DCF-DA and 123-DHR and ROS levels were studied as mentioned in material and methods section. H2O2 (100 &mgr;mol/L) was used as positive control for ROS generation. Data are expressed as mean ± SD and are from representative experiments repeated twice and conducted in triplicate. Statistical significance, bP < 0.001 vs the untreated control; dP < 0.001, aP < 0.05; fP < 0.01 vs CCl4-treated cells.
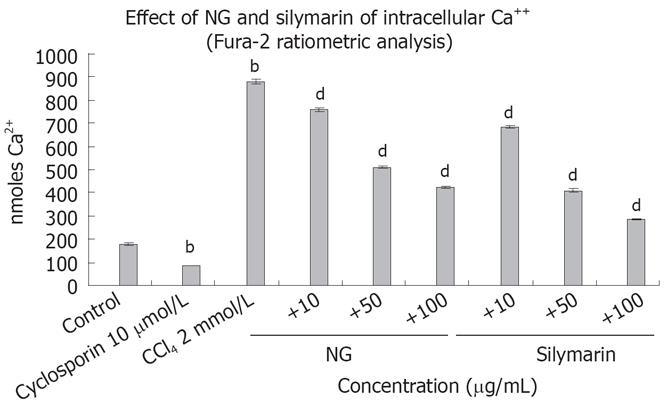
Figure 8 Effect of NG and silymarin against CCl4-induced cytosolic free Ca2+ concentrations.
HuH-7 cells pre-incubated for 1 h with medium containing test materials (NG and silymarin) at different concentrations (10 to 100 mg/L) were exposed to CCl4 (2 mmol/L) for indicated time period, washed and loaded with Fura-2 AM as described in materials and methods section. Cyclosporine (10 &mgr;mol/L) was used as positive control. Data are expressed as mean ± SD, and are from a representative experiments repeated twice and conducted in triplicate. Statistical significance: bP < 0.001 vs the untreated control, dP < 0.001 vs CCl4 treated cells.
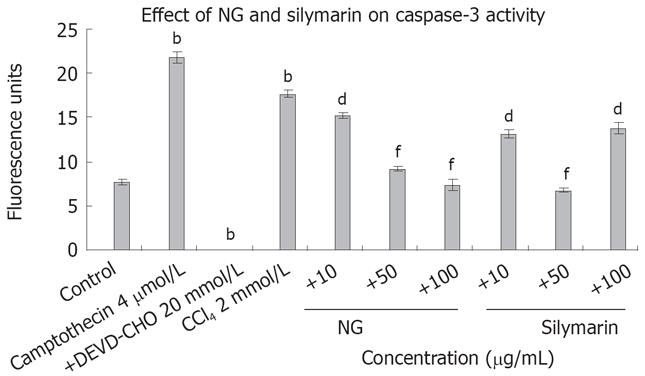
Figure 9 Effect of NG and silymarin against caspase 3-mediated apoptosis.
CCl4 treatment increases caspase 3 activity in HuH-7 cells. HuH-7 cells were treated with CCl4 in presence or absence of test materials (NG and silymarin) and caspase 3 activity was measured as described in Materials and Methods section. Data are expressed as mean ± SD and are from representative experiments repeated twice and conducted in triplicate. Statistical significance: bP < 0.001 vs the untreated control. dP < 0.01; fP < 0.001 vs CCl4-treated cells.
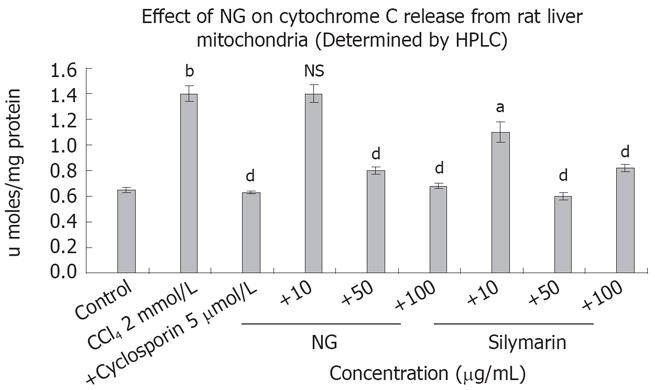
Figure 10 Effect of NG and silymarin against CCl4-induced cytochrome C release from isolated rat liver mitochondria.
CCl4 treatment causes cytochrome C release form rat liver mitochondria. Mitochondria were treated with CCl4 in presence or absence of test materials (NG and silymarin) and cytochrome C levels were measured as described in Materials and Methods section. Data are expressed as mean ± SD and are from a representative experiments repeated twice and conducted in triplicate. Statistical significance: bP < 0.001 vs the untreated control; aP < 0.02; dP < 0.001 and NS = non-significant vs CCl4 treated mitochondria.
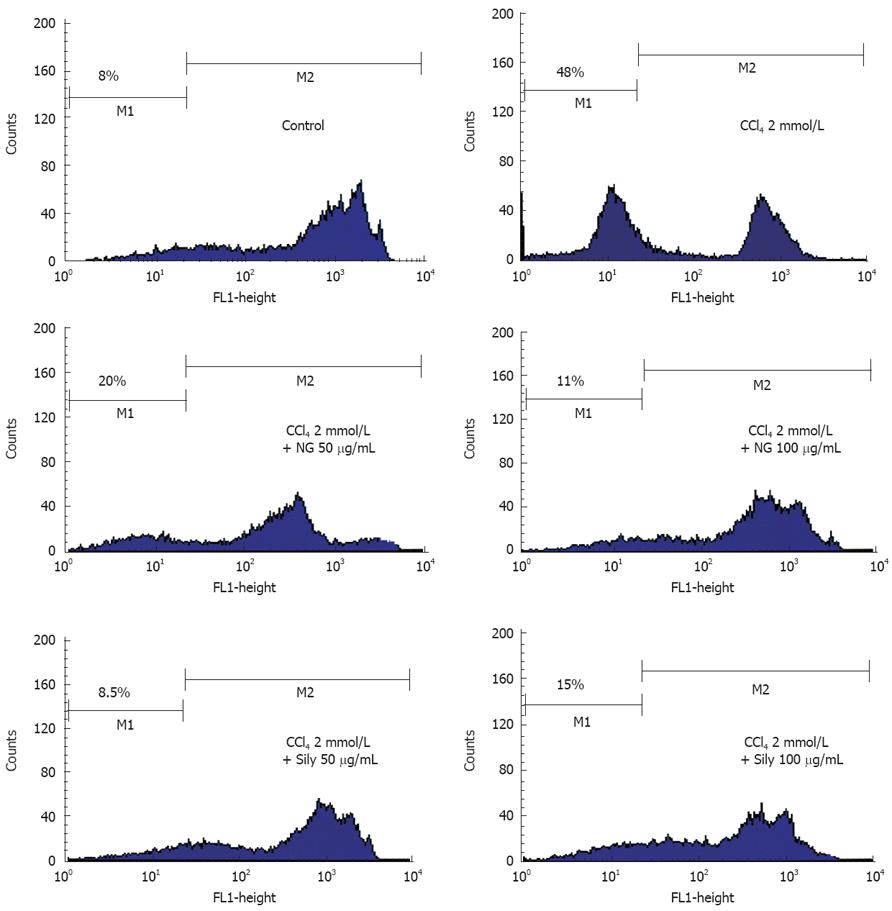
Figure 11 Effect of NG and silymarin against CCl4-induced loss of mitochondrial membrane potential (ΔΨm).
HuH-7 cells were pre-incubated for 1 h with test materials (NG and silymarin) at mentioned concentrations. The cells were further incubated for 24 h with CCl4 (2 mmol/L). Thereafter, cells were stained with Rhodamine-123 and analysed by flow cytometry as described in Materials and Methods section. Representative histograms are shown and the percentage of cells in depolarized zone (M1 zone) are shown.
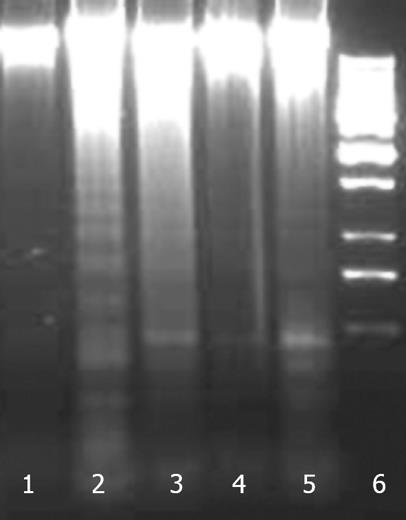
Figure 12 Effect of NG and silymarin against CCl4-induced DNA fragmentation.
HuH-7 cells were pre-incubated for 1 h with test materials (NG and silymarin) at mentioned concentrations. The cells were further incubated for 24 h with CCl4 (2 mmol/L). Thereafter, genomic DNA was extracted from cells and subjected to gel electrophoresis as mentioned in Materials and Methods section. Lanes: 1: Control; 2: CCl4 2 mmol/L; 3: CCl4 2 mmol/L + NG 30 mg/L; 4: CCl4 2 mmol/L + NG 100 mg/L; 5: CCl4 2 mmol/L+ Silymarin 50 mg/L; 6: Ladder.
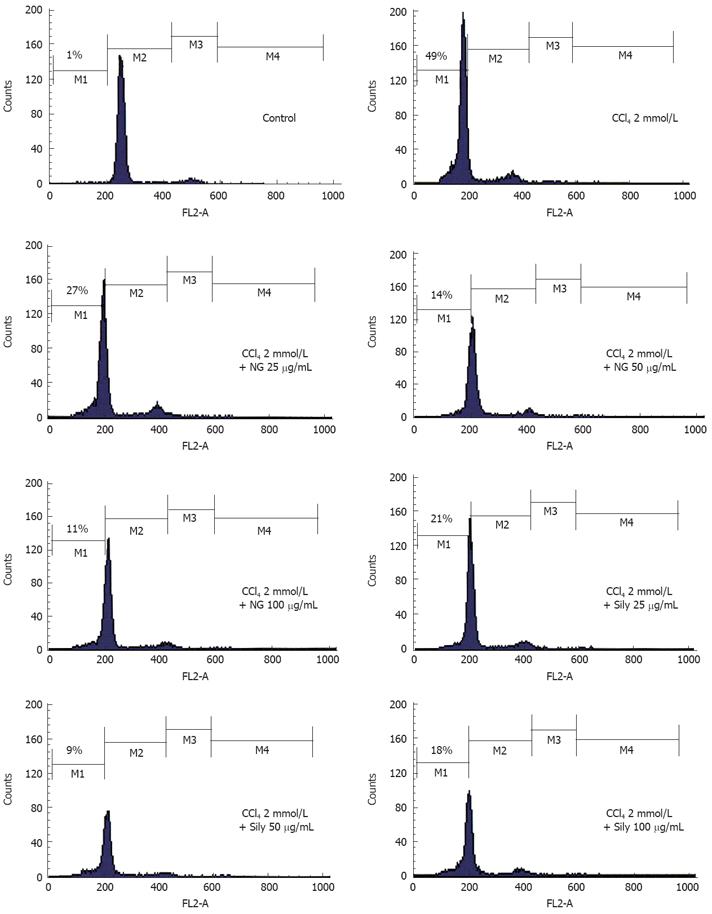
Figure 13 Effect of NG and silymarin against CCl4-induced cell cycle arrest.
HuH-7 cells were pre-incubated for 1 h with test materials (NG and silymarin) at mentioned concentrations. The cells were further incubated for 24 h with CCl4 (2 mmol/L). Thereafter, cells were harvested by trypsinization, fixed with ethanol, stained with PI , and analyzed using flow cytometry. Representative histograms are shown, and the percentage of cells in the sub G0/G1 fraction (M1 zone, hypodiploid area) are shown.
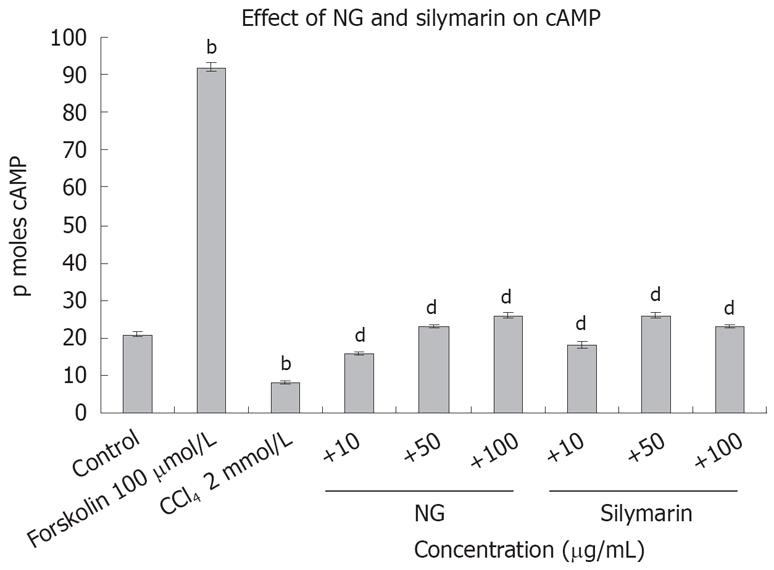
Figure 14 Effect of NG and silymarin against CCl4-depleted cAMP levels.
Pre-incubated, (1 hour at mentioned concentrations of NG and silymarin) HuH-7 cells were exposed to 2 mmol/L CCl4 for 24 h. cAMP levels were determined in the cell culture supernatants as described in Materials and Methods. Forskolin (100 &mgr;mol/L) was used as positive control. Data are expressed as mean ± SD and are from representative experiments repeated twice and conducted in triplicate. Statistical significance: bP < 0.001 vs the untreated control. dP < 0.001 vs CCl4-treated cells.
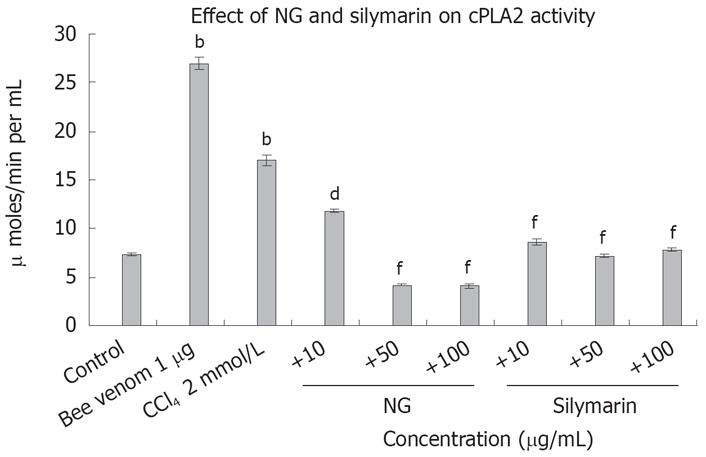
Figure 15 Effect of NG and silymarin against CCl4-induced cPLA2 levels.
Pre-incubated, (1 h with mentioned concentrations of NG and silymarin) HuH-7 cells were exposed to 2 mmol/L CCl4 for 24 h. cPLA2 levels were determined as described in Materials and Methods. Bee venom (1 &mgr;g) was used as positive control. Data are expressed as mean ± SD and are from representative experiments repeated twice and conducted in triplicate. Statistical significance: bP < 0.001 vs the untreated control; dP < 0.01; fP < 0.001 vs CCl4-treated cells.
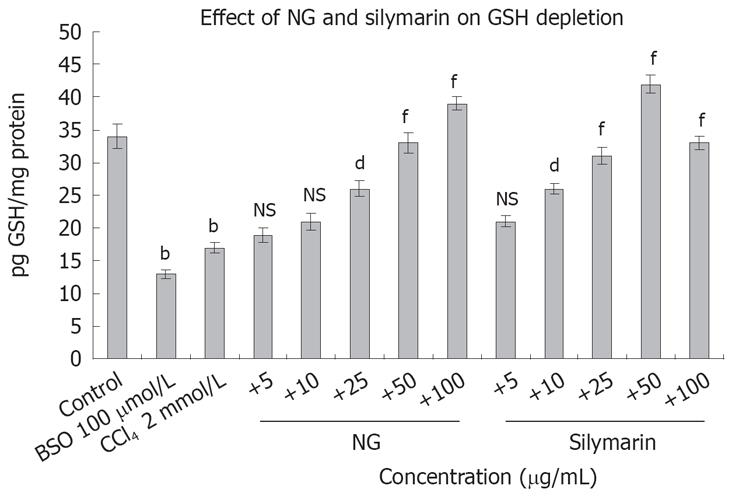
Figure 16 Effect of NG and silymarin on CCl4-induced decrease in GSH levels.
HuH-7 cells were pre-incubated with medium containing test materials (NG and silymarin) for 1 h. The cultures were then further incubated in presence and absence of CCl4 for 24 h. The cells were harvested by scraping and GSH levels were determined as described under Materials and Methods section. BSO (100 &mgr;mol/L) was used as positive control. Data are expressed as mean ± SD and are from representative experiments repeated twice and conducted in triplicate. Statistical significance: bP < 0.001 vs the untreated control; dP < 0.01; fP < 0.001; NS = non-significant vs CCl4-treated cells.
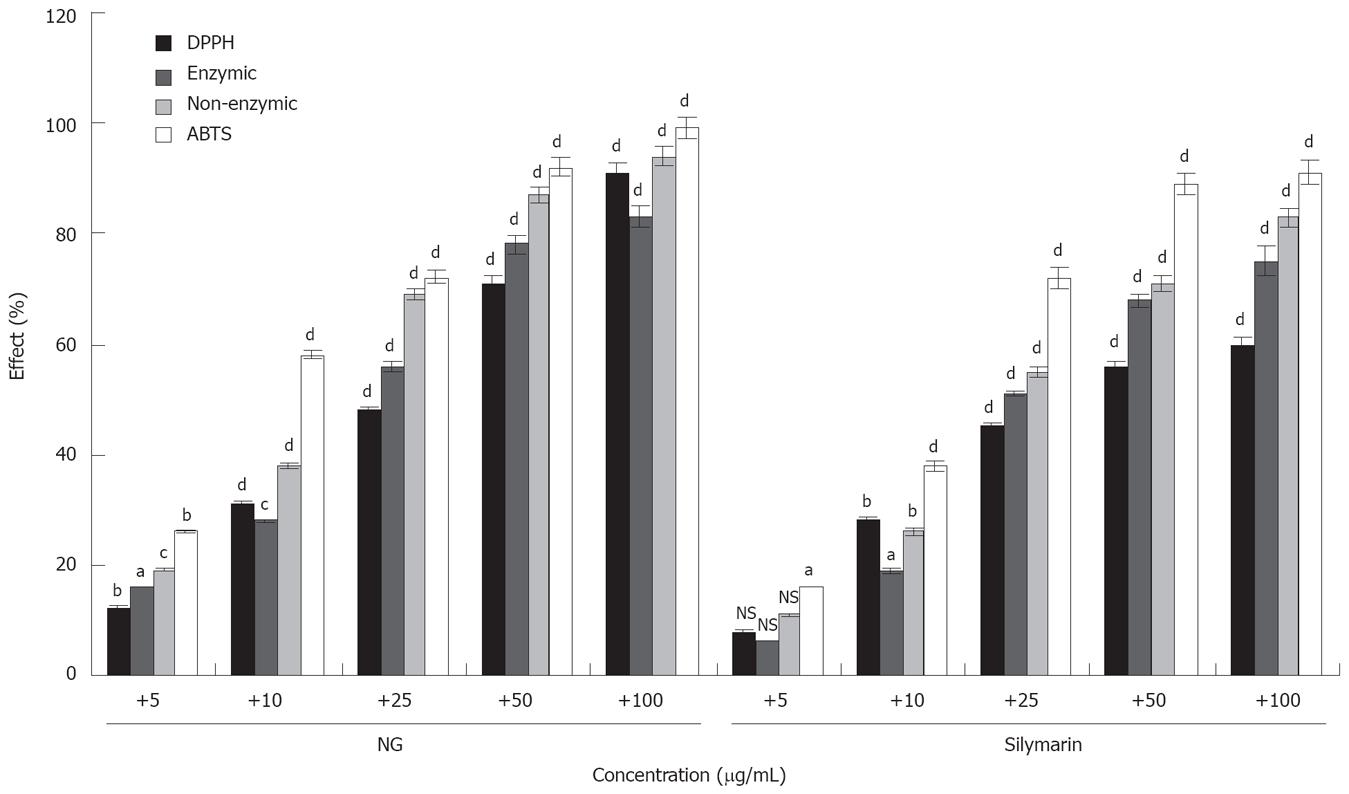
Figure 17 In vitro effect of NG and silymarin on free radicals generation.
Free radicals scavenging effect of NG and silymarin was studied against DPPH radicals (stable hydroxyl radical), enzymic, non-enzymic (superoxide radicals) and ABTS radical (stable hydroxyl radical). Percentage anti-oxidant activity (% effect) was determined as described in Materials and Methods section. Values are mean from five independent determinations. bP < 0.001 versus control. Control O.D. system DPPH, 0.650, system Enzymatic, 0.250 and system Non-enzymatic, 0.300 and system ABTS, 0.750. Data are expressed as mean ± SD and are from a representative experiments repeated twice and conducted in triplicate. Statistical significance: aP < 0.05; bP < 0.01; cP < 0.02; dP < 0.001; NS = non-significant vs respective controls.
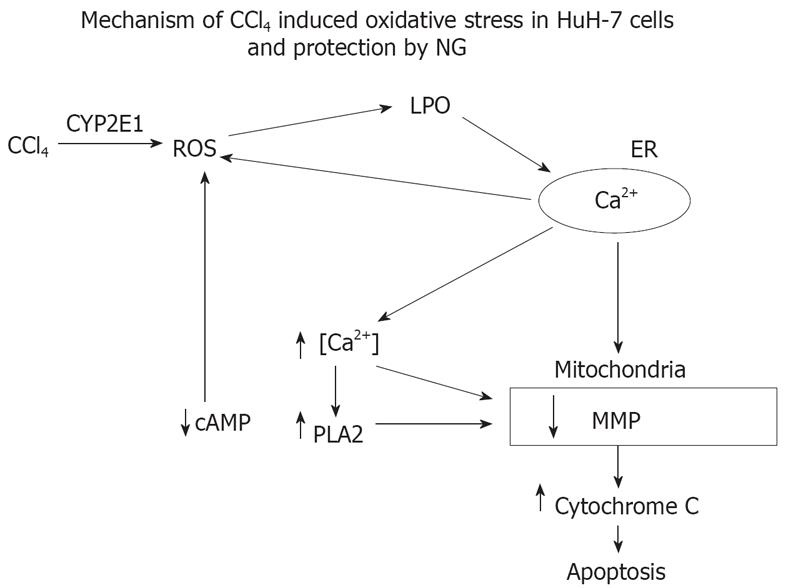
Figure 18 Proposed sequence of events and mechanism involved in the toxicity of CCl4 and cytoprotection offered by NG.
CCl4 is activated by CYP 450 2E1 system and converted into trimethyl CCl3 radicals inducing oxidative stress (increased ROS inducing membrane lipid peroxidation) and disturbed cellular Ca2+ homeostasis. Increase in intracellular Ca2+ concentrations leads to activation of phospholipase A2 and a decline in cAMP levels. All these signaling events converge onto the mitochondrial-initiating mitochondrial pore transition and ultimately to cellular injury. The highly increased levels of ROS is, in part, the consequence of the increase in Ca2+, and also as a result of mitochondrial permeabilization resulting in activation of Ca2+ dependent proteases. NG exerts a protective effect via inhibition of oxidative stress, maintenance of disrupted intracellular calcium homeostasis and inactivation of Ca2+-dependent proteases.
-
Citation: Tasduq SA, Kaiser PJ, Gupta BD, Gupta VK, Johri RK. Negundoside, an iridiod glycoside from leaves of
Vitex negundo , protects human liver cells against calcium-mediated toxicity induced by carbon tetrachloride. World J Gastroenterol 2008; 14(23): 3693-3709 - URL: https://www.wjgnet.com/1007-9327/full/v14/i23/3693.htm
- DOI: https://dx.doi.org/10.3748/wjg.14.3693


