Copyright
©2008 The WJG Press and Baishideng.
World J Gastroenterol. May 14, 2008; 14(18): 2802-2809
Published online May 14, 2008. doi: 10.3748/wjg.14.2802
Published online May 14, 2008. doi: 10.3748/wjg.14.2802
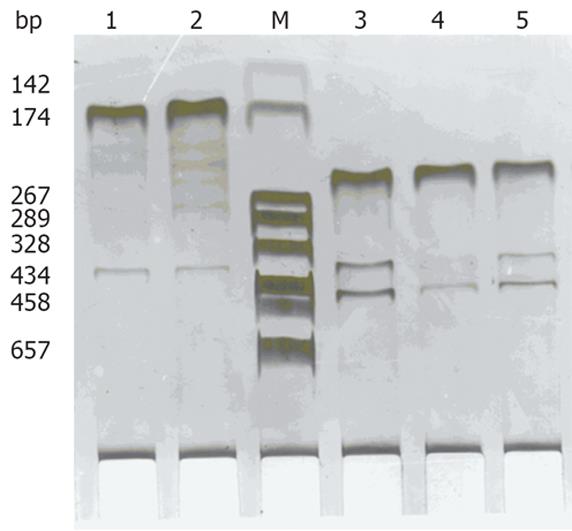
Figure 1 Expression of GAS, SS mRNA by nested RT-PCR analysis in LIC tissue.
Lane M: DNA marker DL 2000; Lane 1-2: Positive expression of GAS; Lane 3-5: Positive expression of SS.
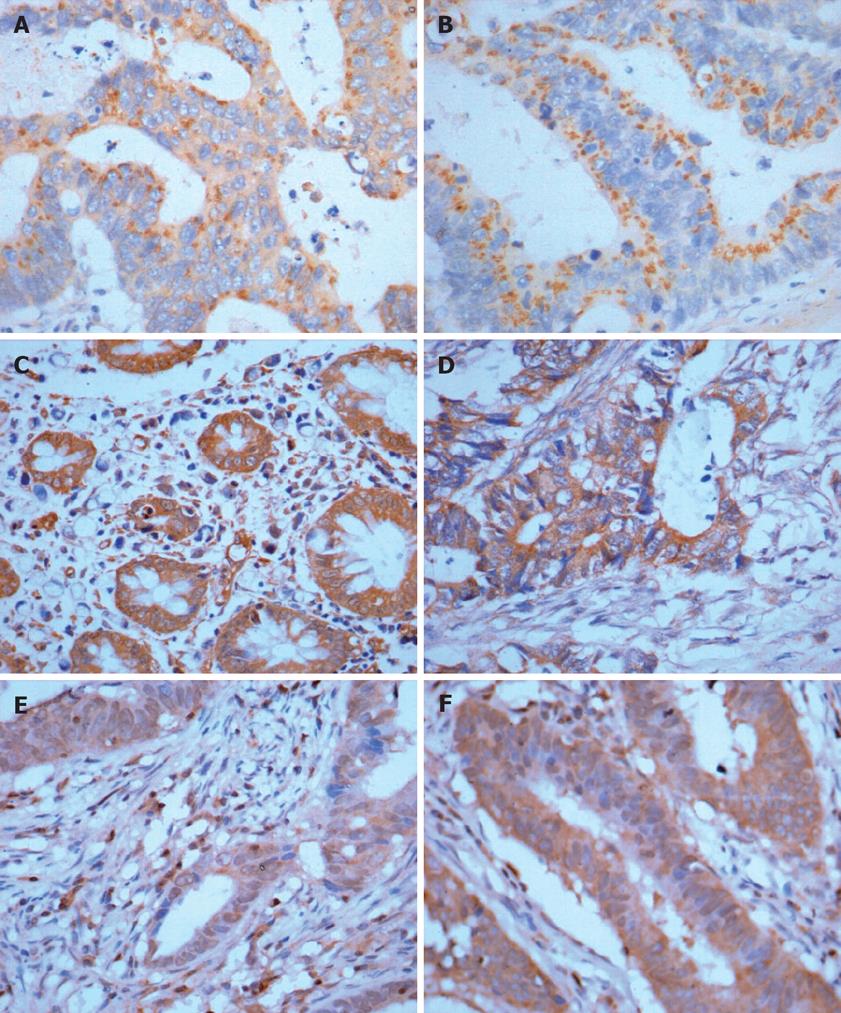
Figure 2 Strong expressions of GAS, SS, Fas, FasL, caspase-3 and caspase-8 in LIC tissues.
A: Strong GAS expression in LIC. S-P × 400; B: Strong SS expression in LIC. S-P × 400; C: Strong Fas expression in SS high expression group. S-P × 400; D: Strong FasL expression in GAS high expression group of colorectal carcinoma. S-P × 400; E: Strong caspase-3 expression in SS high expression group. S-P × 400; F: Strong caspase-8 expression in SS high expression group. S-P × 400.
- Citation: Mao JD, Wu P, Yang YL, Wu J, Huang H. Relationship between expression of gastrin, somatostatin, Fas/FasL and caspases in large intestinal carcinoma. World J Gastroenterol 2008; 14(18): 2802-2809
- URL: https://www.wjgnet.com/1007-9327/full/v14/i18/2802.htm
- DOI: https://dx.doi.org/10.3748/wjg.14.2802


