©2008 The WJG Press and Baishideng.
World J Gastroenterol. May 7, 2008; 14(17): 2650-2661
Published online May 7, 2008. doi: 10.3748/wjg.14.2650
Published online May 7, 2008. doi: 10.3748/wjg.14.2650
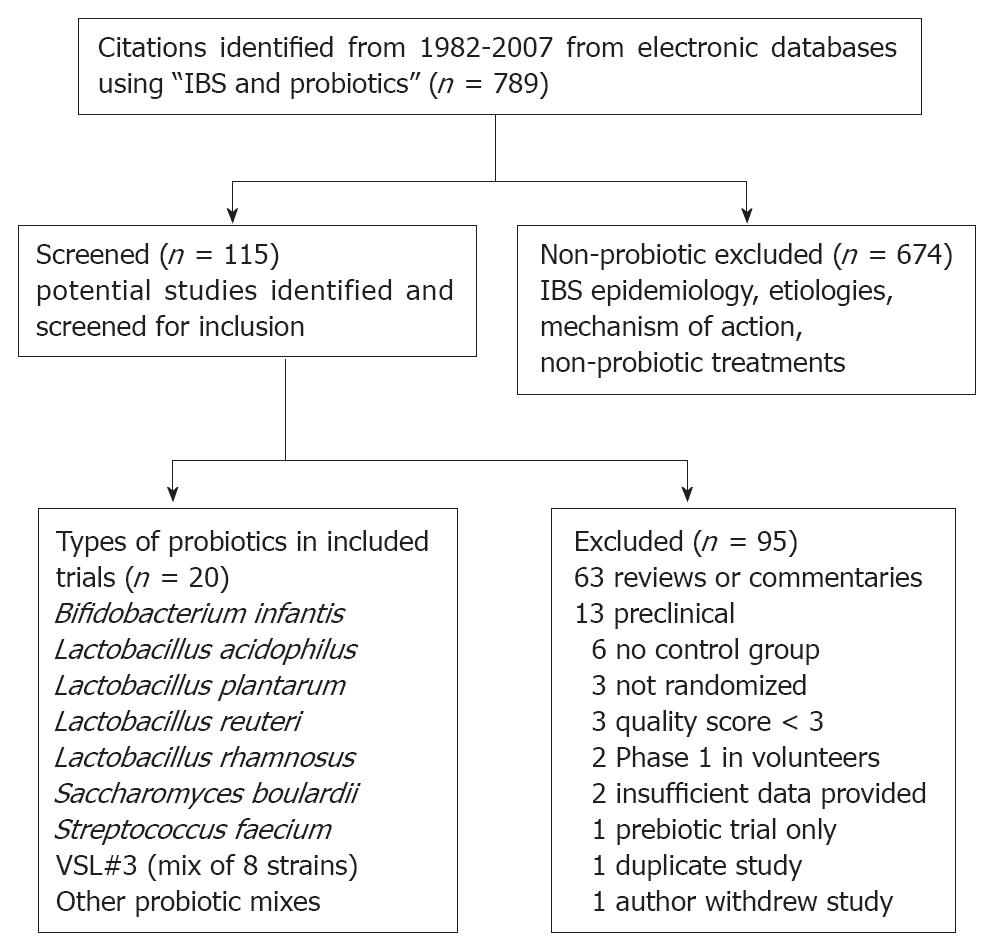
Figure 1 QUOROM flow diagram of included and excluded studies of probiotics for the treatment of Irritable Bowel Syndrome.
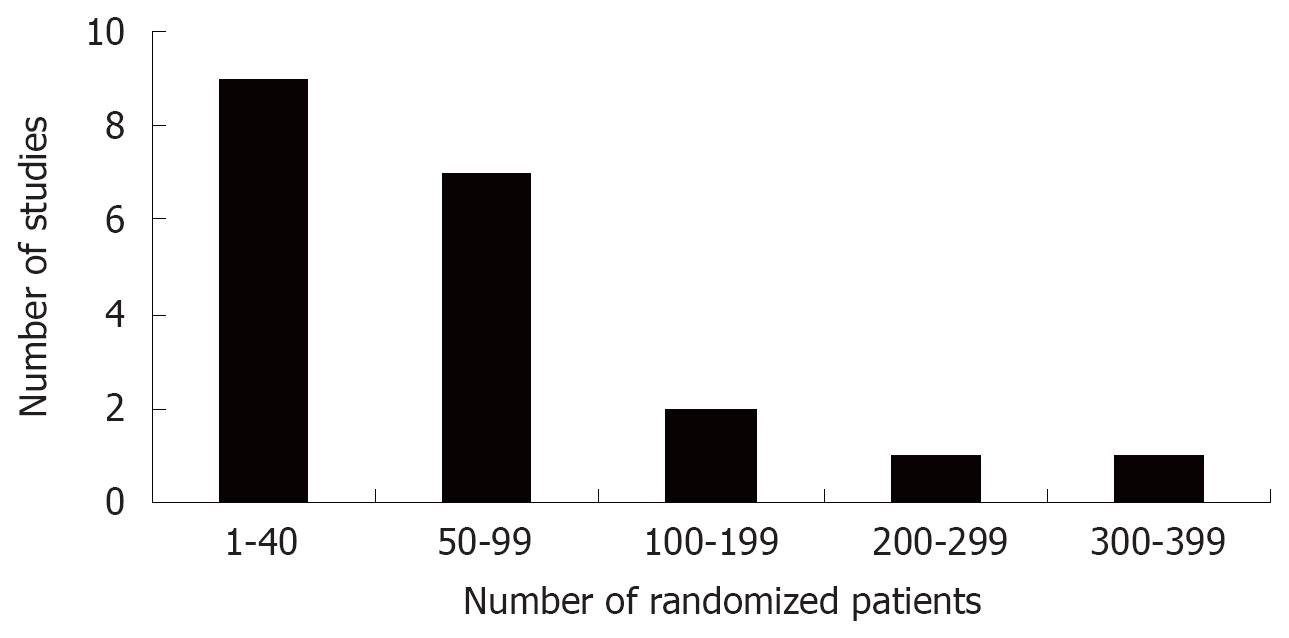
Figure 2 Number of randomized patients in 20 randomized, controlled clinical trials of probiotics for the treatment of Irritable Bowel Syndrome.
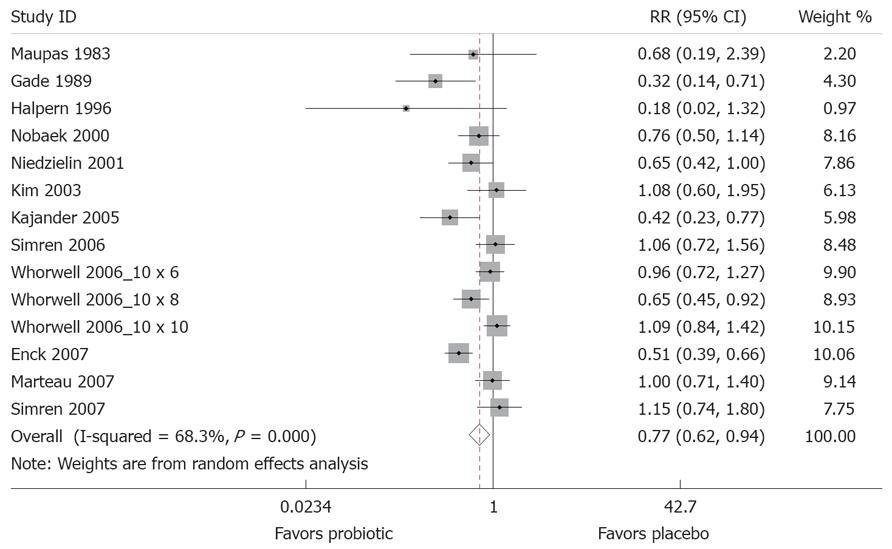
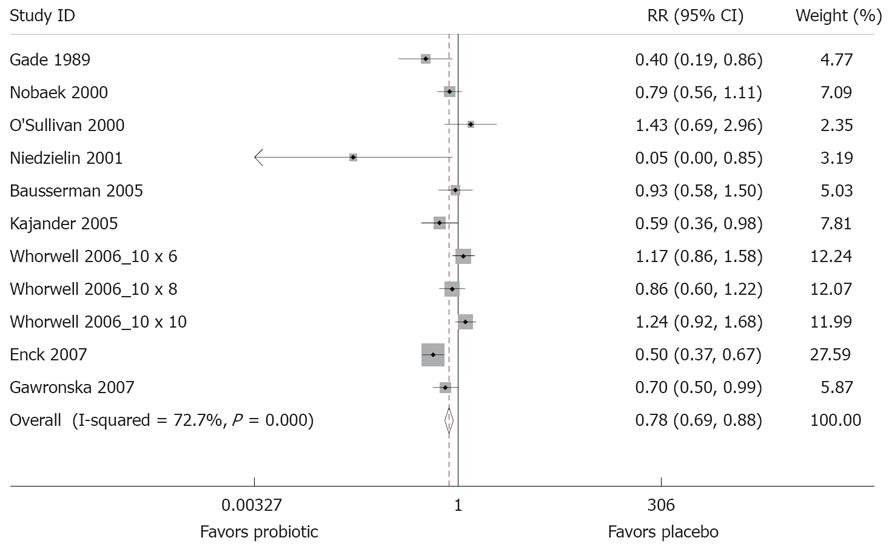
Figure 3 Forest Plot of randomized controlled trials of 14 treatment arms from 12 studies measuring relative risk of IBS symptoms after probiotic treatment compared to placebo.
X-axis is relative risk, with black dot indicating the relative risk, line indicating 95% confidence interval and the size of the grey box proportional to sample size.
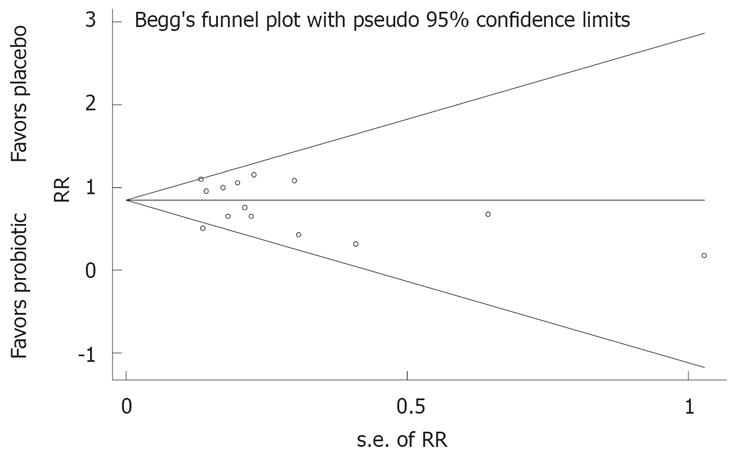
Figure 4 Funnel plots of randomized controlled trials for examining presence of IBS symptoms with probiotic or placebo treatments.
RR: Relative risk of global IBS symptoms; s.e. of RR: Standard error of relative risk, an indicator of sample size.
Figure 5 Forest plot of randomized controlled trials of 12 treatment arms from 10 studies measuring relative risk of abdominal pain after treatment with a probiotic compared to placebo.
The X-axis depicts relative risk, with black dot indicating the relative risk, line indicating 95% CI and the size of the grey box proportional to sample size.
- Citation: McFarland LV, Dublin S. Meta-analysis of probiotics for the treatment of irritable bowel syndrome. World J Gastroenterol 2008; 14(17): 2650-2661
- URL: https://www.wjgnet.com/1007-9327/full/v14/i17/2650.htm
- DOI: https://dx.doi.org/10.3748/wjg.14.2650


