Copyright
©2008 The WJG Press and Baishideng.
World J Gastroenterol. Apr 21, 2008; 14(15): 2349-2357
Published online Apr 21, 2008. doi: 10.3748/wjg.14.2349
Published online Apr 21, 2008. doi: 10.3748/wjg.14.2349
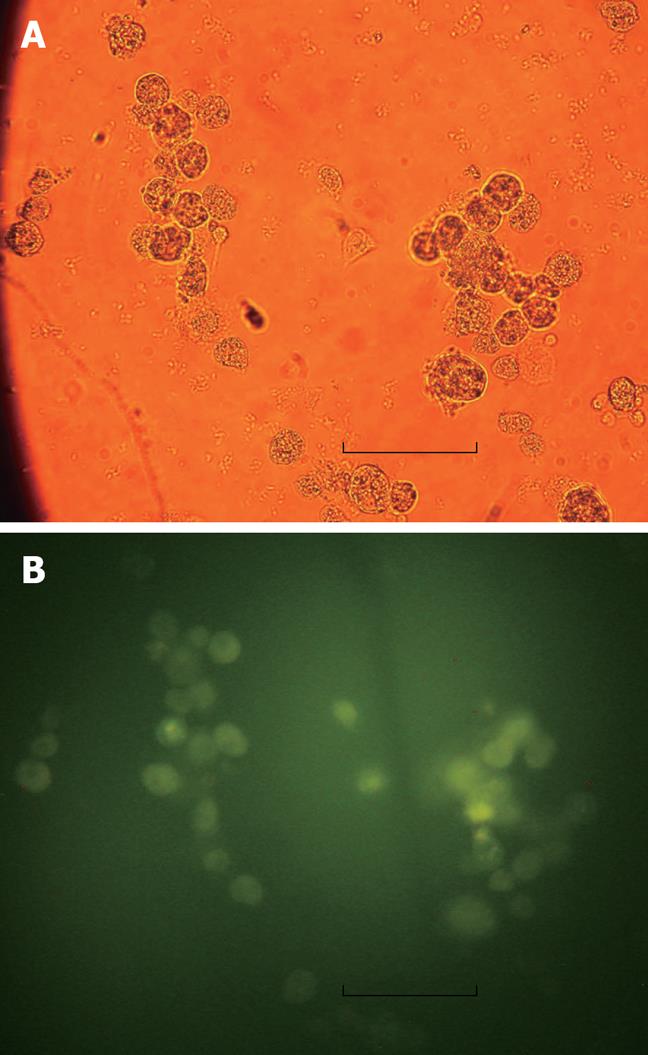
Figure 1 Hepatocytes incubated with EGFP/VEGF plasmid for 24 h.
A: Light microscopy: no green fluorescent protein was found. Bar denotes 30 &mgr;m; B: Immunofluorescence microscopy: green fluorescent protein expression. Bar denotes 30 &mgr;m.
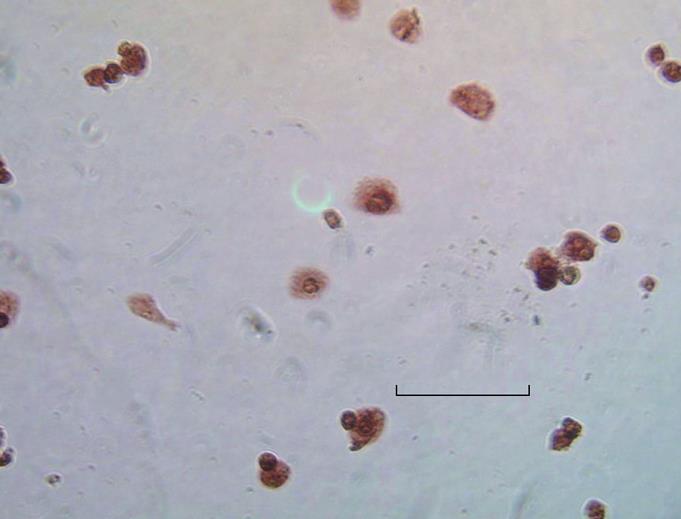
Figure 2 Immunohistochemistry: Positively stained hepatocytes for EGFP/VEGF.
Bar denotes 30 &mgr;m.
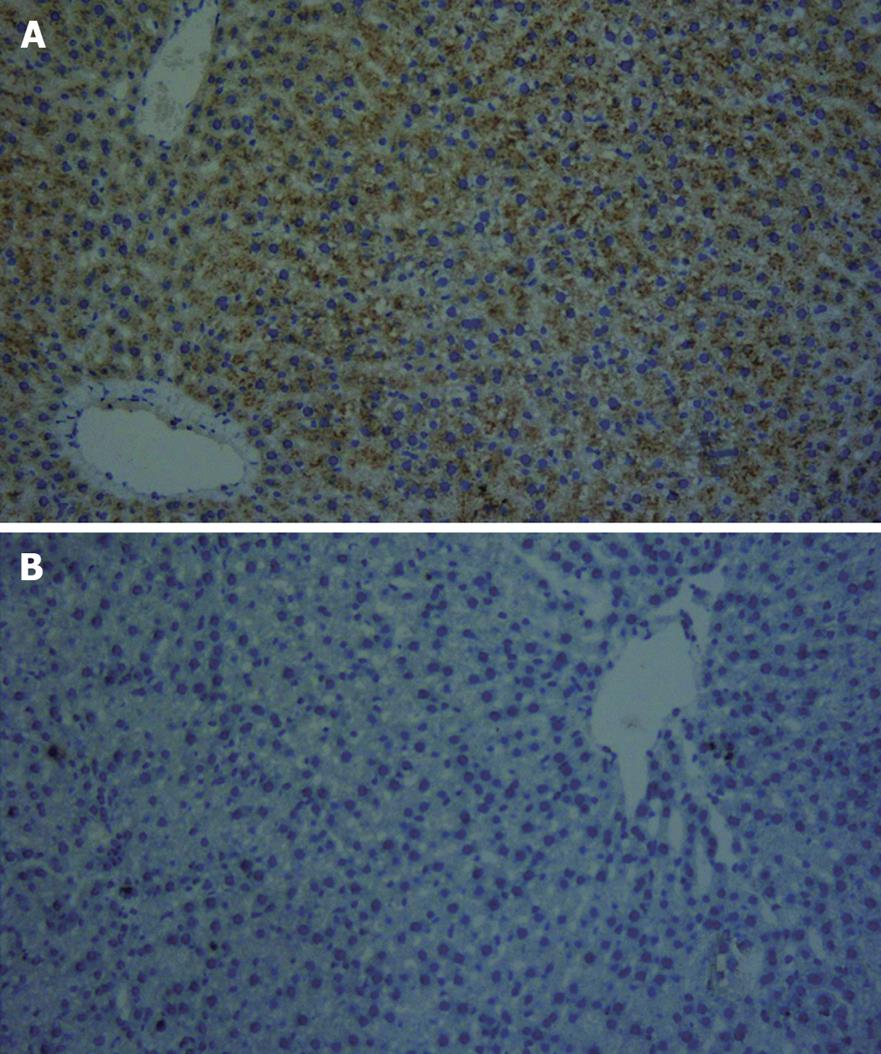
Figure 3 Immunohistochemistry × 200.
A: Study group injected with EGFP/VEGF plasmid, VEGF-positive hepatocytes × 200; B: Control group injected with NS, VEGF-negative hepatocytes.
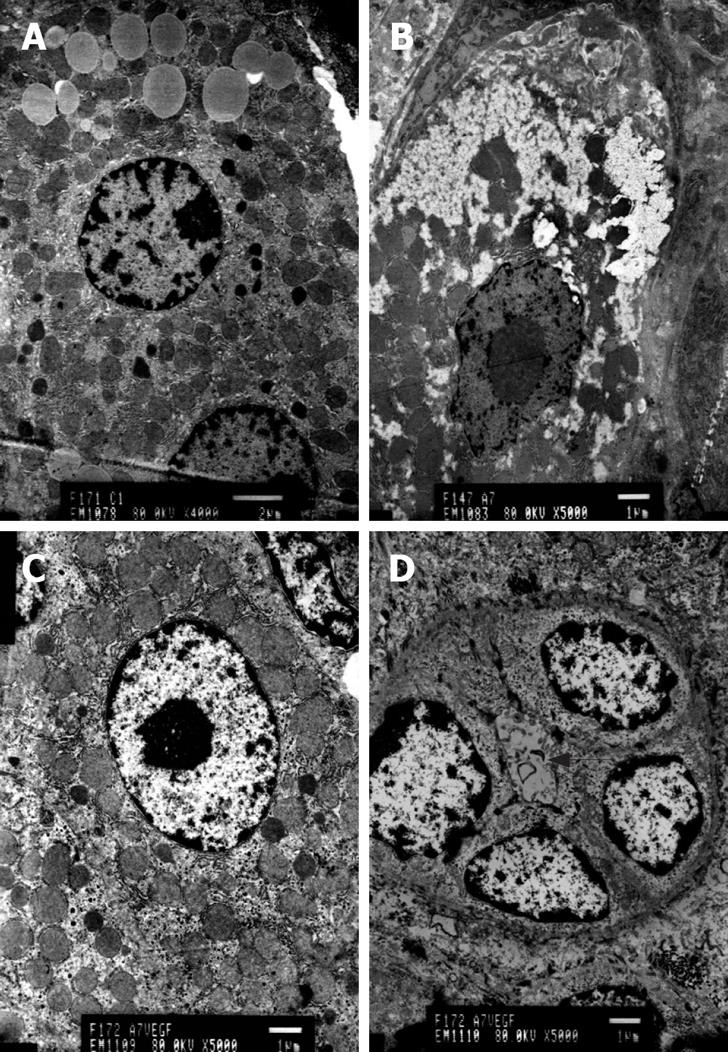
Figure 4 TEM.
A: Normal hepatocytes, Bar denotes 2 &mgr;m; B: Cirrhotic state, hepatocyte apoptosis, Bar denotes 1 &mgr;m; C: Cirrhotic rats injected with the EGFP/VEGF plasmid, hepatocyte apoptosis decreased, Bar denotes 1 &mgr;m; D: Cirrhotic rats injected with EGFP/VEGF plasmid, Regenerated hepatocytes and cholangiole arrowhead, Bar denotes 1 &mgr;m.
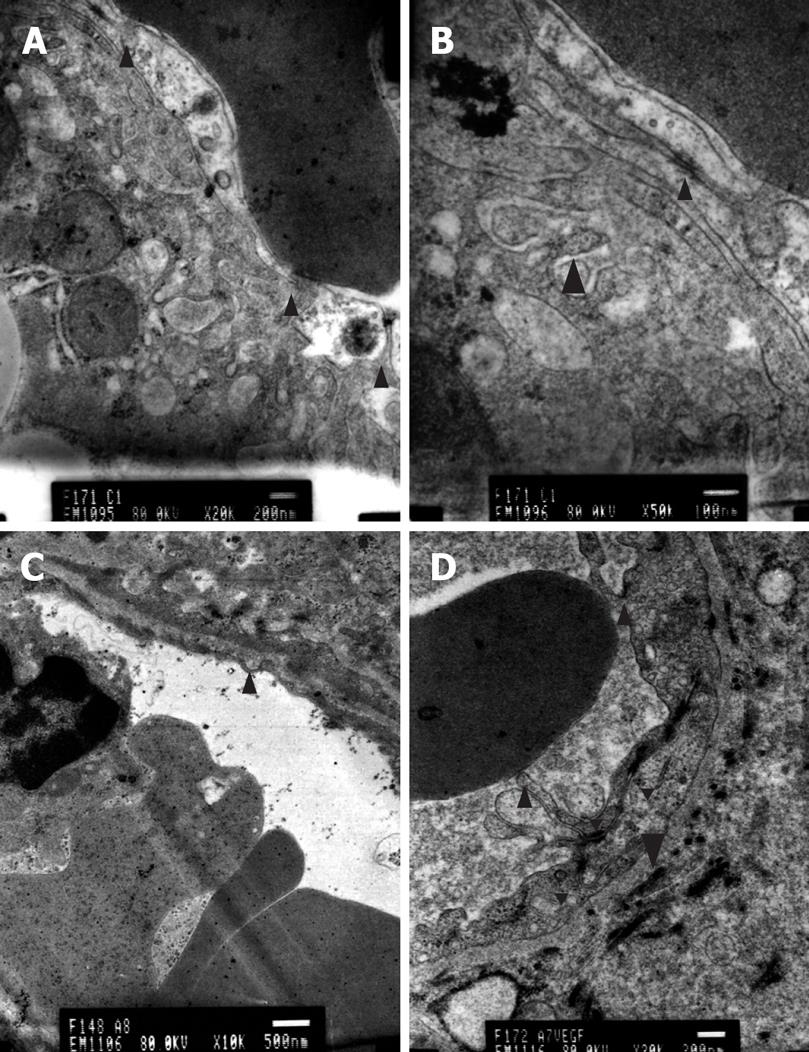
Figure 5 TEM.
A: Normal state, LSECs and fenestrae (arrowhead). Bar denotes 200 nm; B: Normal state. Cell conjuction between LECs (small arrowhead) and microvilli of hepatocytes (large arrowhead). Bar denotes 100 nm; C: Cirrhotic state. Fenestrae, cell conjuction and microvilli of hepatocytes disappeared, and a basement membrane appeared (arrowhead). Bar denotes 500 nm; D: VEGF treated group. Fenestrae (small arrowhead), microvilli (large arrowhead) and cell conjunctions between LECs (triangle) appeared, Bar denotes 200 nm.
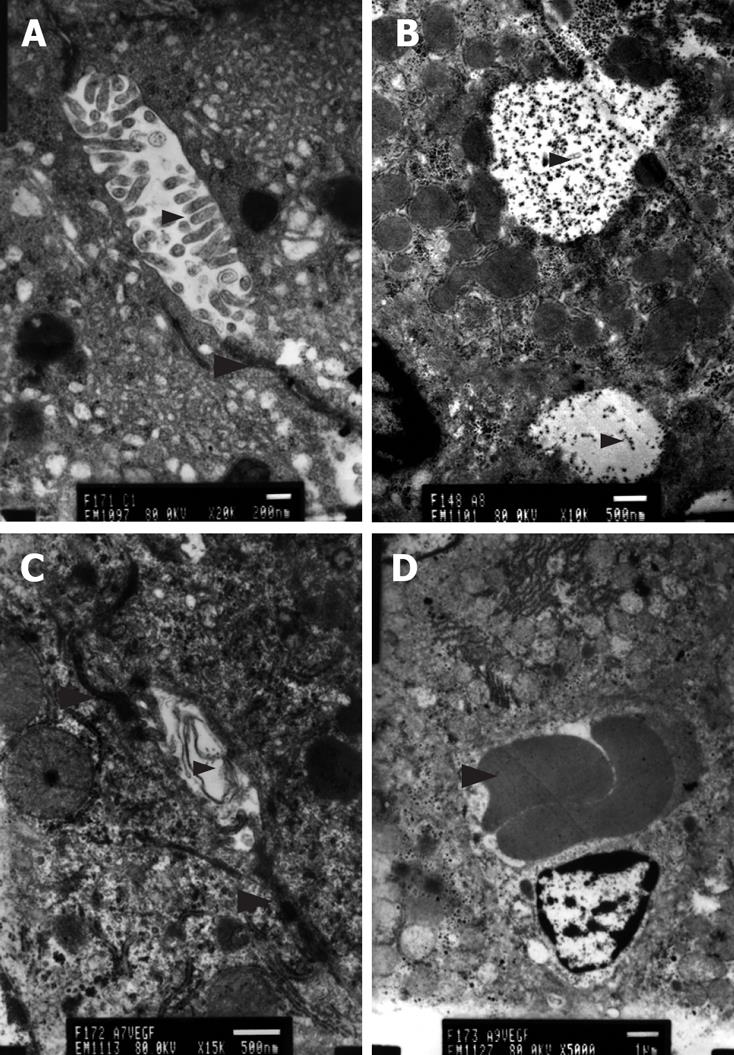
Figure 6 TEM.
A: Normal state. Cholangiole, microvilli(small arrowhead) and cell conjuction between hepatocytes (large arrowhead). Bar denotes 200 nm; B: Cirrhotic state. Microvillus, cell conjuction disappeared and particles of bilirubin (arrowhead) overflowed. Bar denotes 500 nm; C: Treated group. Microvilli (small arrowhead) and cell conjunctions (large arrowhead) appeared and bilirubin overflow diminished. Bar denotes 500 nm; D: Treated group. Newborn capillary (arrowhead). Bar denotes 1 &mgr;m.
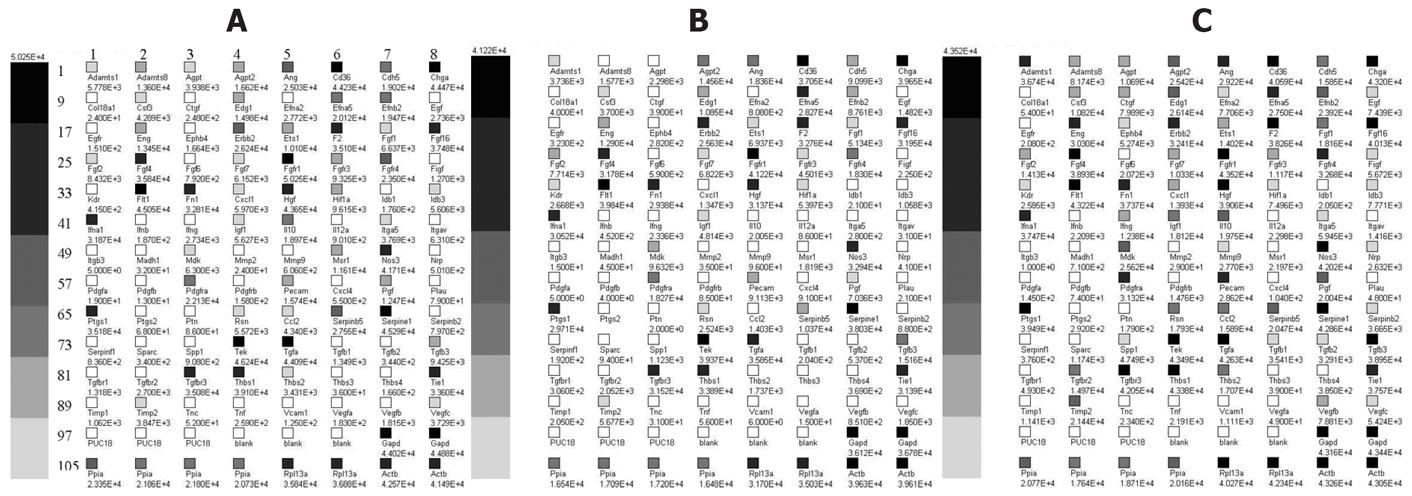
Figure 7 Representative expression profile of angiogenesis-related genes in the liver.
The gene microarray included angiogenesis-related genes (1-96), negative control genes (97-99), blank controls (100-102), positive control genes (glyceraldehyde-3-phosphate dehydrogenase (103, 104), cyclophilin A (105-108), ribosomal protein L13a (109, 110) and b-actin (111,112). A: Normal state; B: Cirrhotic state; C: VEGF treated group.
- Citation: Xu H, Shi BM, Lu XF, Liang F, Jin X, Wu TH, Xu J. Vascular endothelial growth factor attenuates hepatic sinusoidal capillarization in thioacetamide-induced cirrhotic rats. World J Gastroenterol 2008; 14(15): 2349-2357
- URL: https://www.wjgnet.com/1007-9327/full/v14/i15/2349.htm
- DOI: https://dx.doi.org/10.3748/wjg.14.2349


