Copyright
©2008 The WJG Press and Baishideng.
World J Gastroenterol. Apr 7, 2008; 14(13): 2003-2009
Published online Apr 7, 2008. doi: 10.3748/wjg.14.2003
Published online Apr 7, 2008. doi: 10.3748/wjg.14.2003
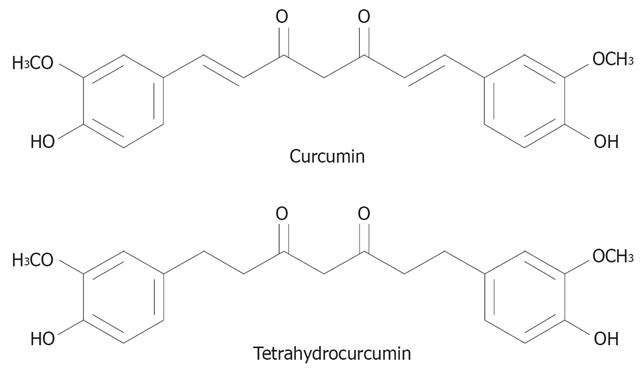
Figure 1 Chemical structures of CUR and THC.
CUR and THC have similar β-diketo and phenolic moieties.
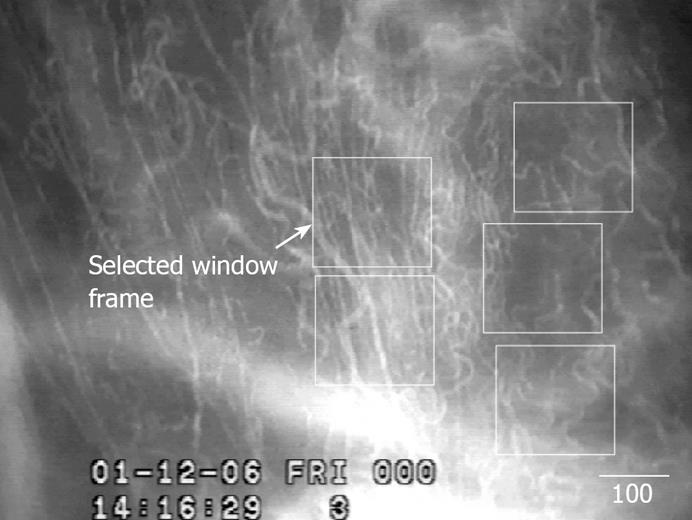
Figure 2 An example of 5 windows selected for measurement of capillary vascularity (CV) from the video-image at a low magnification (× 10, Bar = 100 &mgr;m).
Figure 3 IC50 and cell growth index by MTT assay.
A: Effects of CUR on cell proliferation of HepG2 cell; B: Effects of THC on cell proliferation of HepG2 cell. Values given represent the mean ± SE of three independent experiments carried out in triplicate. The IC50 value was required to decrease viability from 100% to 50%.
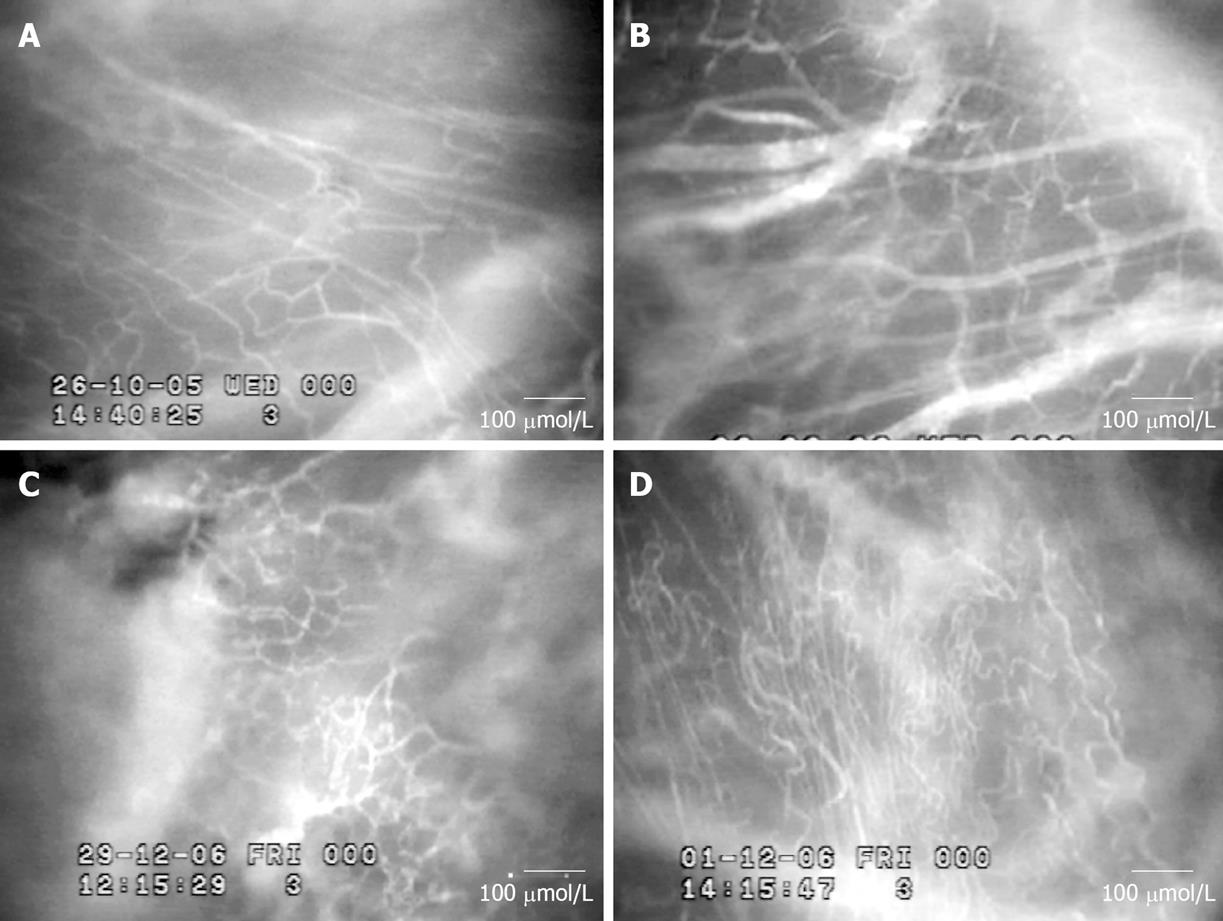
Figure 4 A: Fluorescence videoi-mage of the microvasculature for control; B: Fluorescence videoimage of the microvasculature for 7 d HepG2 groups; C: Fluorescence videoimage of the microvasculature for 14 d HepG2 groups 14; D: Fluorescence videoimage of the microvasculature for 21 d HepG2 groups (× 10, Bar = 100 &mgr;m).
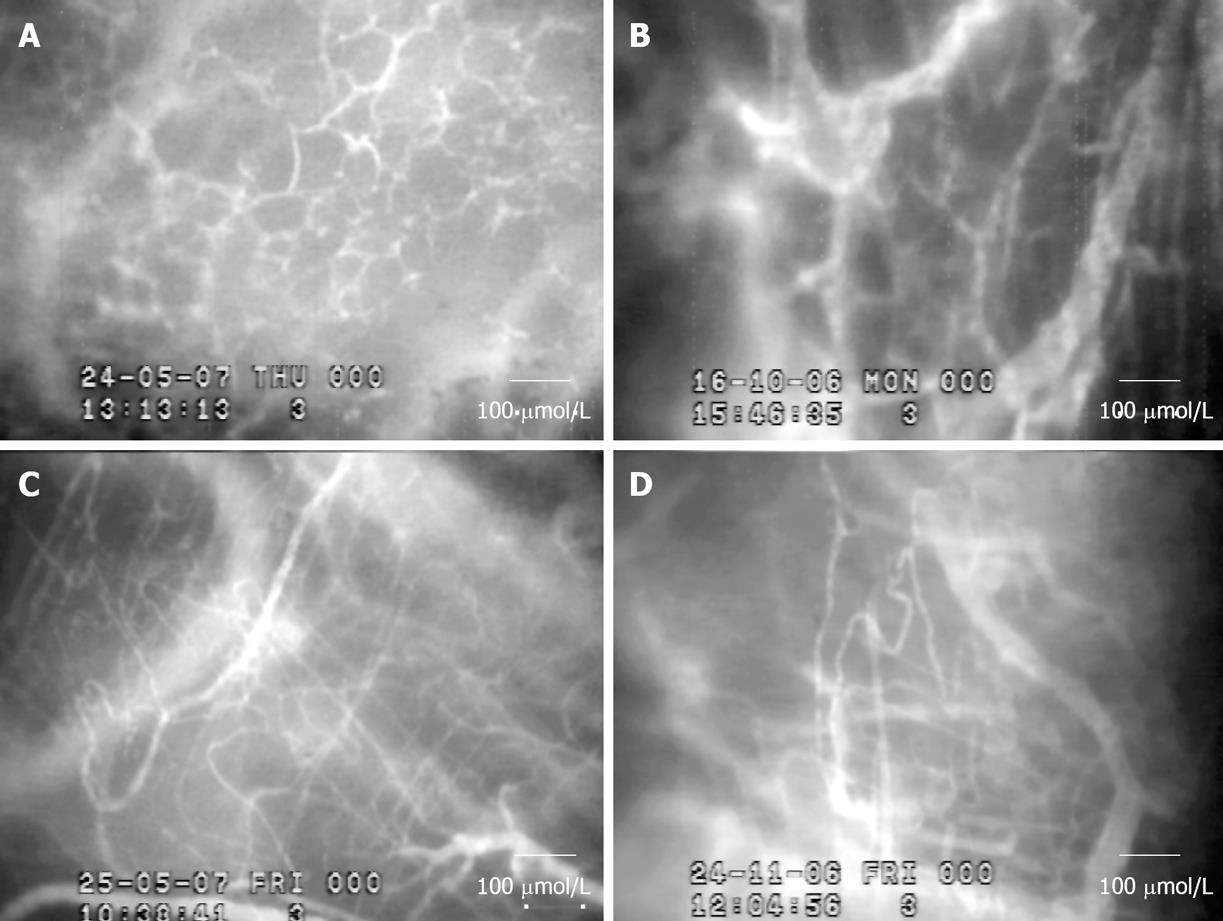
Figure 5 A: Fluorescence video-image of capillary vascularity on 14 d after the implantation of tumor cells with treatment of CUR (3000 mg/kg); B: Fluorescence videoimage of capillary vascularity on 14 d after the implantation of tumor cells with treatment of THC (3000 mg/kg); C: Fluorescence videoimage of capillary vascularity on 21 d after the implantation of tumor cells with treatment of CUR (3000 mg/kg); D: Fluorescence videoimage of capillary vascularity on 21 d after the implantation of tumor cells with treatment of THC (3000 mg/kg, × 10, Bar = 100 &mgr;m).
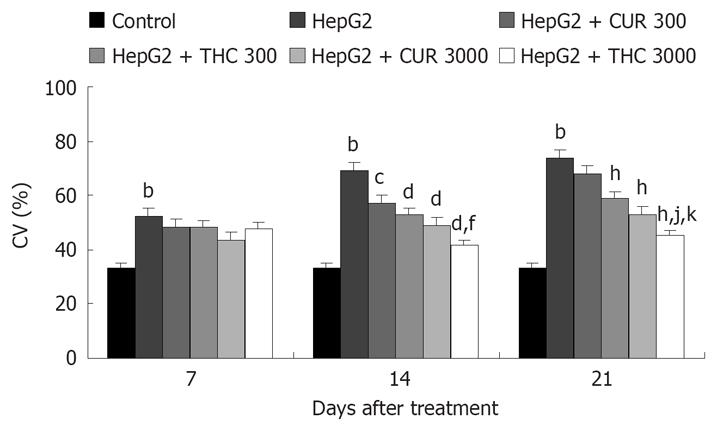
Figure 6 Capillary vascularity (mean ± SE) of 7 d, 14 d, and 21 d after vehicle (0.
1% DMSO), CUR or THC (300 and 3000 mg/kg BW) treatment in control and HepG2 groups. aP < 0.001, vs control group with vehicle; bP < 0.005, vs 14 d HepG2 group with vehicle; cP < 0.001, vs 14 d HepG2 group with vehicle; dP < 0.01, vs 14 d HepG2-THC 300 group; eP < 0.001, vs 21 d HepG2 group with vehicle; fP < 0.001, vs 21 d HepG2-THC 300 group; gP < 0.05, vs 21 d HepG2-CUR 3000 group.
- Citation: Yoysungnoen P, Wirachwong P, Changtam C, Suksamrarn A, Patumraj S. Anti-cancer and anti-angiogenic effects of curcumin and tetrahydrocurcumin on implanted hepatocellular carcinoma in nude mice. World J Gastroenterol 2008; 14(13): 2003-2009
- URL: https://www.wjgnet.com/1007-9327/full/v14/i13/2003.htm
- DOI: https://dx.doi.org/10.3748/wjg.14.2003


