Copyright
©2007 Baishideng Publishing Group Co.
World J Gastroenterol. Mar 7, 2007; 13(9): 1438-1444
Published online Mar 7, 2007. doi: 10.3748/wjg.v13.i9.1438
Published online Mar 7, 2007. doi: 10.3748/wjg.v13.i9.1438
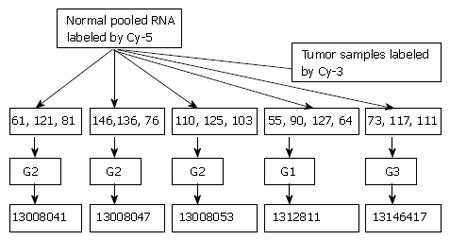
Figure 1 Experimental design: G1, G2 and G3 indicate well-differentiated, moderately and poorly differentiated squamous cell carcinoma respectively.
13008041-53, 1312811 and 13146417 indicated barcode of microarray chips.
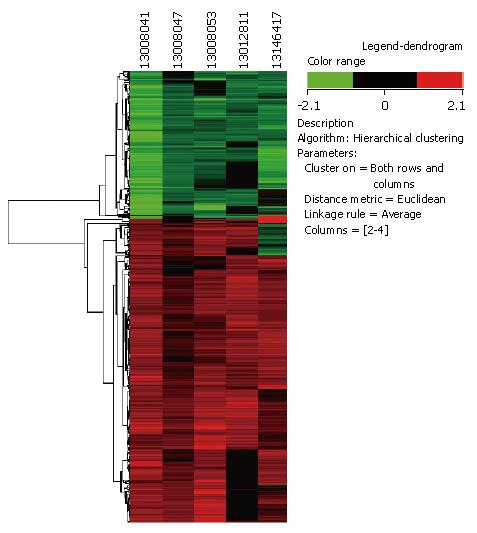
Figure 2 Hierarchical Clustering (Average Linkage Clustering) of the genes that were over or under expressed in tumor versus normal tissue in the 16 ESCC patients.
- Citation: Chattopadhyay I, Kapur S, Purkayastha J, Phukan R, Kataki A, Mahanta J, Saxena S. Gene expression profile of esophageal cancer in North East India by cDNA microarray analysis. World J Gastroenterol 2007; 13(9): 1438-1444
- URL: https://www.wjgnet.com/1007-9327/full/v13/i9/1438.htm
- DOI: https://dx.doi.org/10.3748/wjg.v13.i9.1438


