Copyright
©2007 Baishideng Publishing Group Co.
World J Gastroenterol. Mar 7, 2007; 13(9): 1393-1398
Published online Mar 7, 2007. doi: 10.3748/wjg.v13.i9.1393
Published online Mar 7, 2007. doi: 10.3748/wjg.v13.i9.1393
Math 1 Math(A1).
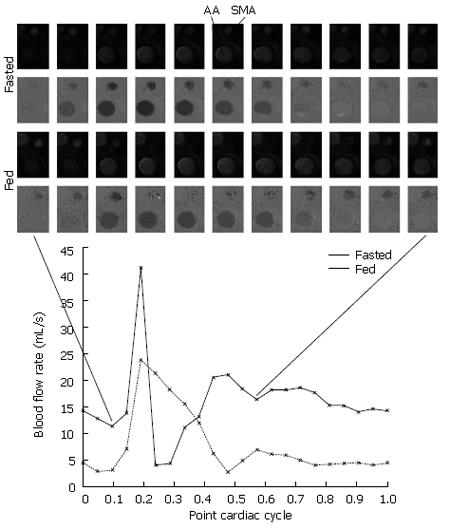
Figure 1 Fasted (top) and fed (bottom) cine phase-contrast magnitude (upper) and phase (lower) images of the SMA and abdominal aorta with associated graph of fasted and postprandial flow profiles, showing signal loss through peak systole in the fed case.
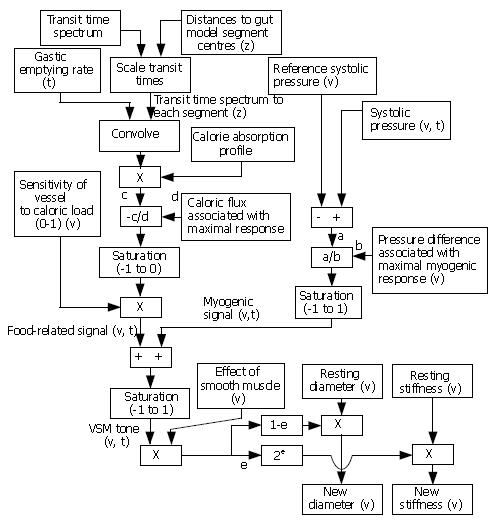
Figure 2 Suggested framework for control of gut blood flow.
“(v)”denotes dependence of a parameter on the vessel in question, “(z)” on gut segment of interest, and “(t)” on time.
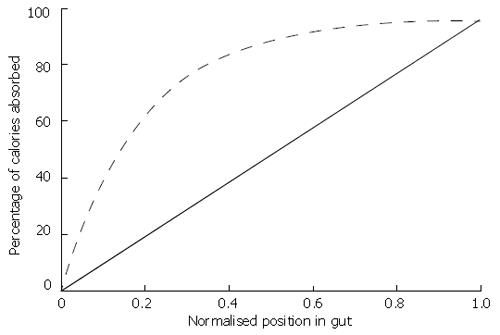
Figure 3 Linear (solid line) and exponential (dashed line) calorie absorption profiles.
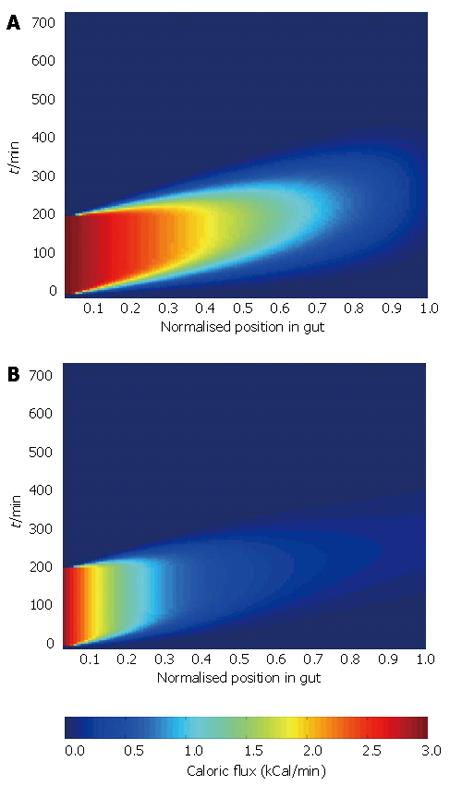
Figure 4 Pseudocolour plots showing caloric load against time and position in the gut for given gastric emptying and transit spectrum data with 96% gastric efficiency, based on linear (A) and asymptotic (B) absorption profiles.
- Citation: Jeays AD, Lawford PV, Gillott R, Spencer PA, Bardhan KD, Hose DR. A framework for the modeling of gut blood flow regulation and postprandial hyperaemia. World J Gastroenterol 2007; 13(9): 1393-1398
- URL: https://www.wjgnet.com/1007-9327/full/v13/i9/1393.htm
- DOI: https://dx.doi.org/10.3748/wjg.v13.i9.1393


