
















©2007 Baishideng Publishing Group Co.
World J Gastroenterol. Mar 7, 2007; 13(9): 1384-1392
Published online Mar 7, 2007. doi: 10.3748/wjg.v13.i9.1384
Published online Mar 7, 2007. doi: 10.3748/wjg.v13.i9.1384
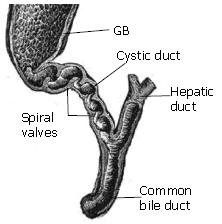
Figure 1 The geometry of the biliary tract, where the valves of Heister in the cystic duct are shown.
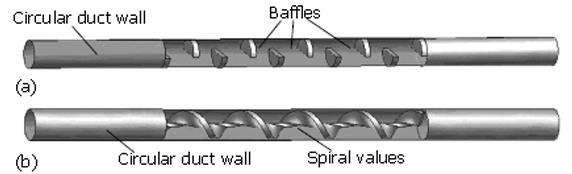
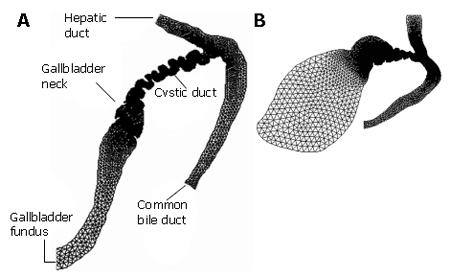
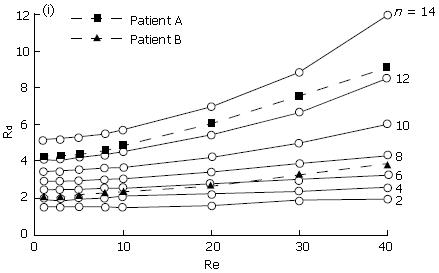
Figure 4 The resistance, Rd, plotted with the Reynolds number, Re (which is defined as the ratio of inertia over viscous forces, and is proportional to the flow rate for a given duct and bile).
n is the number of the baffles in the duct[43] (modified from Journal of Biomechanics, vol. 37, page 1913-1922, Figure 6).
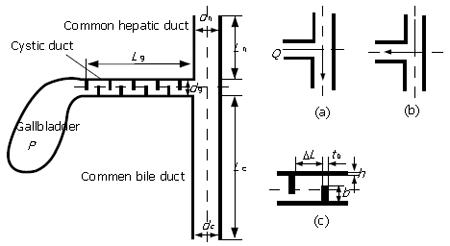
Figure 5 One-dimensional model of human billiary system and bile flow directions in the (a) emptying and (b) refill phases, (c) details of baffles at one section of the cystic duct[44].
p is the pressure inside the gallbladder, and Q is the flow rate of bile fluid. (Modified from figure 2 to be published in ASME Journal of Biomechanical Engineering).
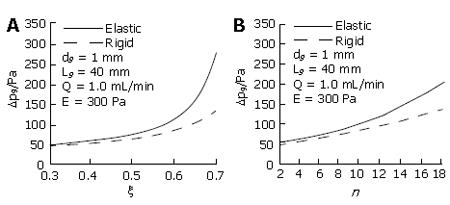
Figure 6 Pressure loss variations with baffle height ratio (A) and baffle number (B) for both rigid and elastic models[44].
(Modified from figure 8 to be published in ASME Journal of Biomechanical Engineering).
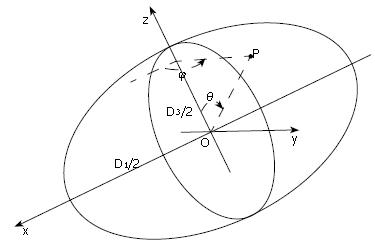
Figure 7 Gallbladder body shape during emptying is assumed to be ellipsoidal with major and minor axis lengths D1, D2 and D3 (D1 > D2≥ D3); the gallbladder is subjected to a uniform internal pressure.
The stress due to the pressure at any point P has three components, σθ (meridian), σφ (latitude) and τθφ (in surface)[85].
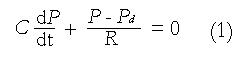
Math 1 Math(A1).
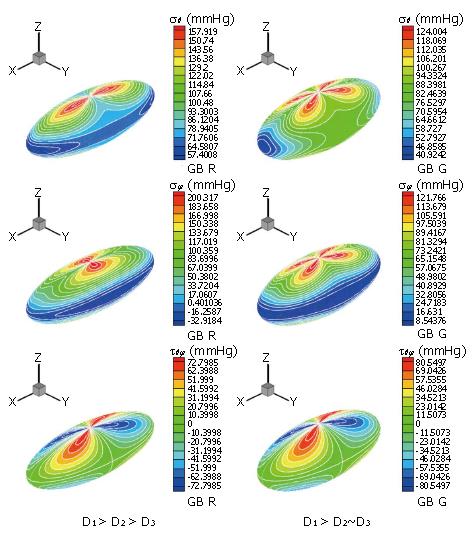
Figure 8 Li et al[85] calculated the stress distributions for two different subjects: R (left) and G (right).
The top frame is the principal meridian stress, σθ, the middle frame is the principal latitude stress, σφ, and the bottom one is the in-plane shear stress τθφ. It is seen that the location and the maximum stresses change as the ratio of the lengths of the three axes change.
- Citation: Luo X, Li W, Bird N, Chin SB, Hill N, Johnson AG. On the mechanical behavior of the human biliary system. World J Gastroenterol 2007; 13(9): 1384-1392
- URL: https://www.wjgnet.com/1007-9327/full/v13/i9/1384.htm
- DOI: https://dx.doi.org/10.3748/wjg.v13.i9.1384