Copyright
©2007 Baishideng Publishing Group Co.
World J Gastroenterol. Mar 7, 2007; 13(9): 1378-1383
Published online Mar 7, 2007. doi: 10.3748/wjg.v13.i9.1378
Published online Mar 7, 2007. doi: 10.3748/wjg.v13.i9.1378
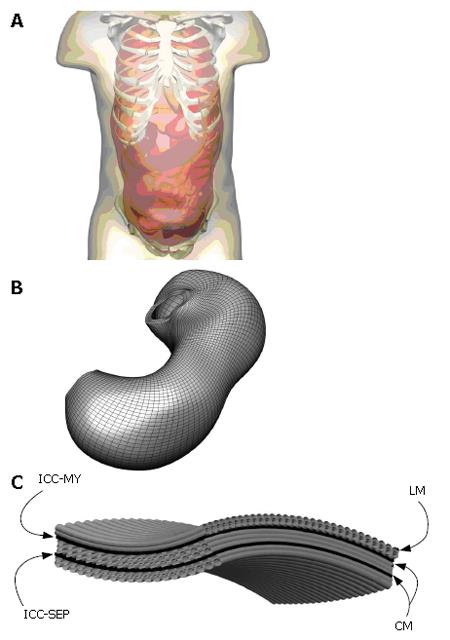
Figure 1 Shown above in (A) is the skin surface enclosing the esophageous, stomach, small and large intestines and a portion of the skeletal system where the components of the digestive system were created from digitized images from the visible man project.
Shown in (B) is an enlarged view of the stomach with a high resolution mesh created over the finite elements that define the stomach geometry and (C) is an enlarged view of layers and muscle fibers on that stomach. Specifically modelled are the longitudinal (LM) and circular muscle (CM) layers separated by the ICC-MY (myenteric) and ICC-SEP (septa) layers.
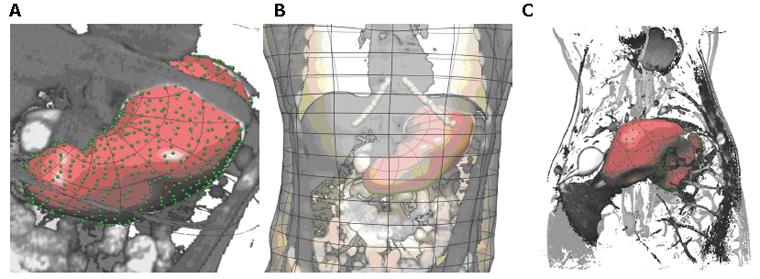
Figure 2 Gastric geometric models of a normal human (A and B) and pig (C).
A: Enlarged view of human stomach surface with green points showing the digitized points of the stomach, overlaid with a CT image; B: the fitted stomach and skin surfaces with a CT image overlaid. The costal margin is outlined by the white interconnected points. C: Anterior view of a pig stomach created from MR images. Shown are the digitised points corresponding to the stomach (green points), the stomach surface (transparent surface) as well as a coronal MR image from which the model was created.
Figure 3 Anterior views of models of stomachs created from CT images acquired from 4 different human volunteers, illustrating some of the high degree of anatomical variability.
Shown are the stomach (red surfaces), skin (transparent surface) and the costal margin (white interconnected points).
Math 1 Math(A1).
Math 2 Math(A2).
Math 3 Math(A3).
Math 4 Math(A4).
Math 5 Math(A5).
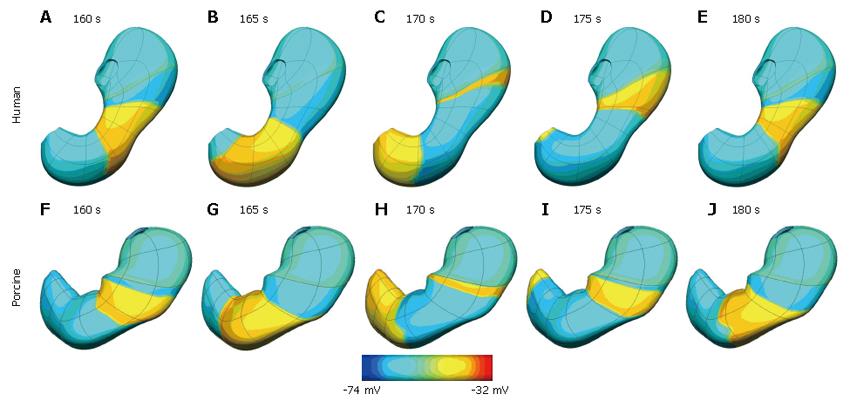
Figure 4 Simulation results at five second intervals showing gastric slow wave activity wave in a human (A-E) and porcine (F-J) stomach.
The human stomach has a dominant frequency of 3.0 cpm while the porcine model has a dominant frequency of 3.7 cpm. Shown above is the transmembrane potential distribution on the outer surface of the stomach coloured by the scale bar below the images.
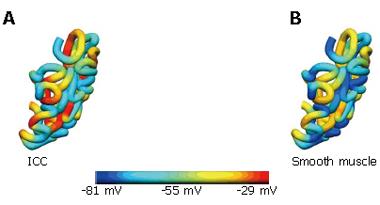
Figure 5 Slow wave intestinal activity.
Shown are the transmembrane potentials from the (A) ICC and (B) smooth muscle layers at a particular time instance.
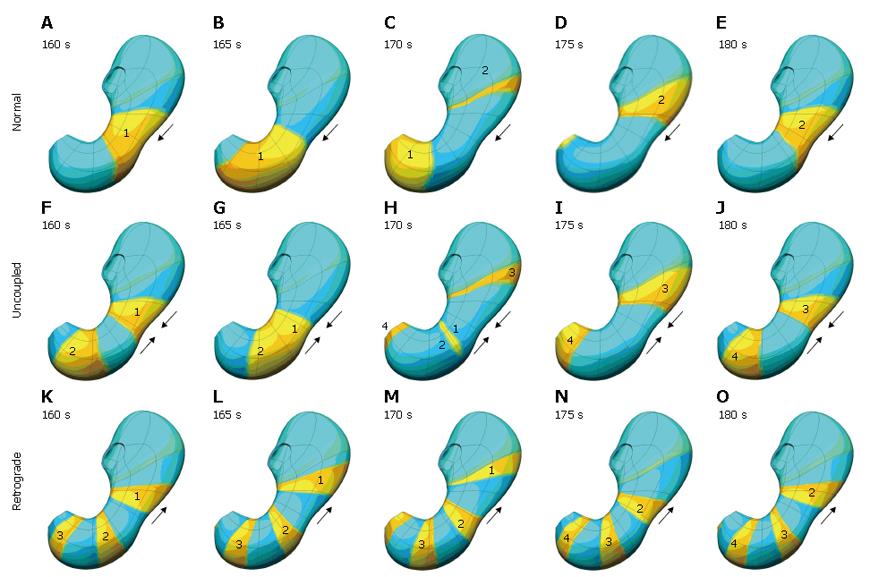
Figure 6 Top row (A-E) shows normal slow wave activity at 5 second interval.
In this case the antrum is entrained by the slow wave activity originating in the corpus, is shown. In the second row (F-J), the corpus and antrum maintain the same frequency of slow wave activity, but in this situation, the antrum is not being entrained by the activity of the corpus. The bottom row (K-O) illustrates what happens when the intrinsic frequency of the antrum exceeds that of the corpus, resulting in some retrograde slow wave behaviour.
- Citation: Cheng LK, Komuro R, Austin TM, Buist ML, Pullan AJ. Anatomically realistic multiscale models of normal and abnormal gastrointestinal electrical activity. World J Gastroenterol 2007; 13(9): 1378-1383
- URL: https://www.wjgnet.com/1007-9327/full/v13/i9/1378.htm
- DOI: https://dx.doi.org/10.3748/wjg.v13.i9.1378


