Copyright
©2007 Baishideng Publishing Group Co.
World J Gastroenterol. Feb 21, 2007; 13(7): 1060-1066
Published online Feb 21, 2007. doi: 10.3748/wjg.v13.i7.1060
Published online Feb 21, 2007. doi: 10.3748/wjg.v13.i7.1060
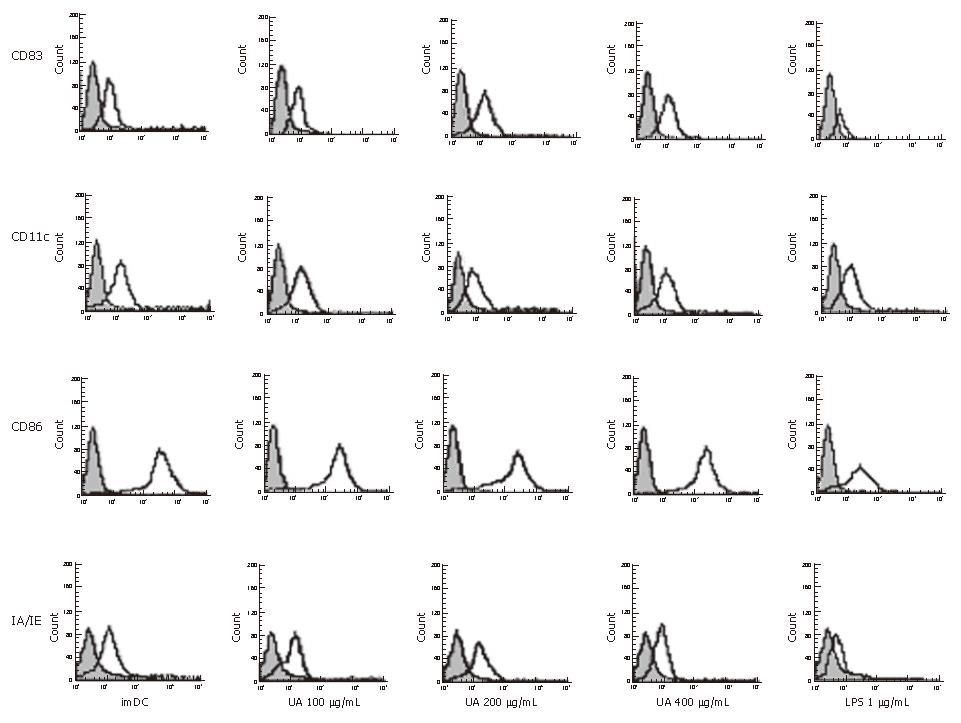
Figure 1 The cell surface markers analysis on dendritic cells by flow cytometry after exposure to uric acid or LPS.
Bone marrow-derived DCs were stimulated with 100, 200 and 400 μg/mL uric acid or 1 μg/mL LPS or Serum-free RPMI media 1640 for 48 h and immunostained with mAbs against CD11c, CD83, CD86 and IA/IE molecules (open histograms). Shade histograms represent the isotype control mAb staining of the cells. The histograms (Figure 1) and data (Table 1) are representative of five independent experiments.
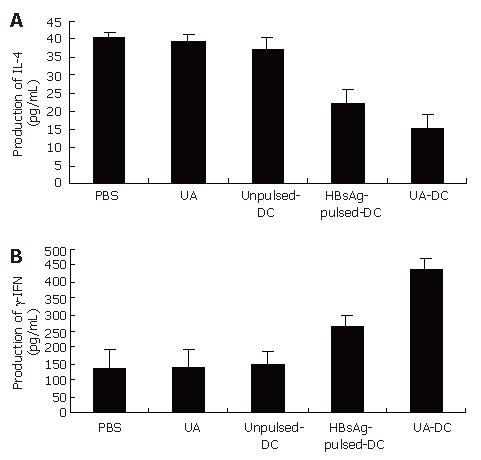
Figure 2 Cytokine production by splenocytes.
Fourteen days after immunization, spleen cells were isolated, then stimulated with HBsAg (10 μg/mL) in vitro. Values were measured at 72 h for IL-4 (A), IFN-γ (B) by ELISA. The results are representative of ten samples from each group. The data show the mean ± SD.
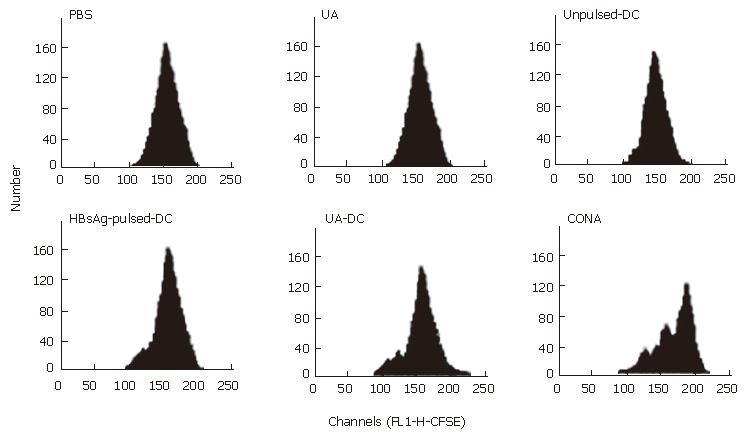
Figure 3 Celluar proliferative response in spleen T cells after stimulation with HBsAg or PBS for 72 h in vitro.
Celluar proliferative response was estimated by flow cytometry. Spleen T cells of PBS group mice were cultured with HBsAg or PBS and ConA, used as ConA group. Histogram was produced by the modfit 3.0 software packages. These results showed were from individual mice that were representative of per experiment group.
Figure 4 Analyze CTL activity against HBsAg of immunization mice by flow cytometry in vivo at 2 wk.
Flow cytometric analysis of each mouse was adoptively transferred with a 1:1 mixture of Protein-pulsed (CFSEhigh) and unpulsed (CFSElow) naive mouse splenocytes 10 h previously. Then ratio between percentage of CFSElow cells and CFSEhigh cells were calculated. HBsAg-specific CTL cytotocity was determined (Table 5). These histogram results were from individual mice that were representative of ten experiments.
- Citation: Ma XJ, Tian DY, Xu D, Yang DF, Zhu HF, Liang ZH, Zhang ZG. Uric acid enhances T cell immune responses to hepatitis B surface antigen-pulsed-dendritic cells in mice. World J Gastroenterol 2007; 13(7): 1060-1066
- URL: https://www.wjgnet.com/1007-9327/full/v13/i7/1060.htm
- DOI: https://dx.doi.org/10.3748/wjg.v13.i7.1060


