Copyright
©2007 Baishideng Publishing Group Co.
World J Gastroenterol. Feb 14, 2007; 13(6): 821-825
Published online Feb 14, 2007. doi: 10.3748/wjg.v13.i6.821
Published online Feb 14, 2007. doi: 10.3748/wjg.v13.i6.821
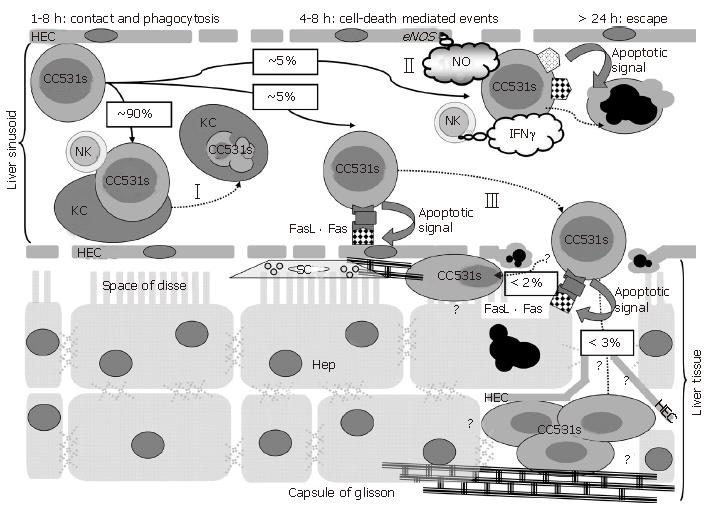
Figure 1 Schematic representation of the local hepatic sinusoidal immune defence system in the different steps of CRC liver metastasis (Steps I to III) as outlined in detail in the “Phagocytosis, Apoptosis, Endothelial Retraction and Tumour Survival"-section.
The subsequent steps in the metastatic cascade as denoted by question marks illustrate that considerable work remains, especially once CRC cells traverse the sinusoidal endothelial lining and invade the liver tissue.
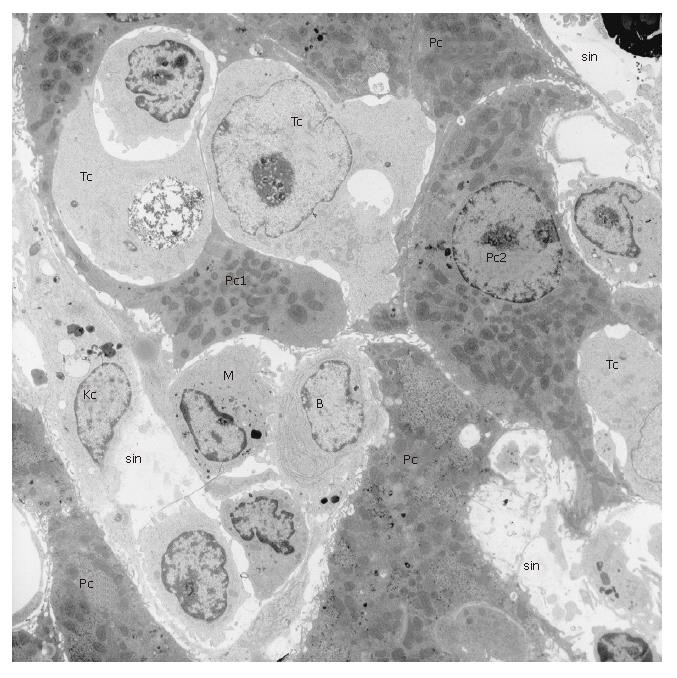
Figure 2 Transmission electron microscopy photomicrograph at low magnification (6700 x) of rat liver one week after i.
v. injection of one million CC531s colon cancer cells. Tumour cells (Tc) can be recognized by a ribosome-rich, bulky cytoplasm containing few organelles. Tumour cell nuclei are large and contain mostly euchromatin. In this picture, tumour cells have already taken position in the liver parenchyma and compress or deform the parenchymal cells (Pc1 and Pc2). In this stage, tumour cells are so numerous that defending cells, such as Kupffer cells (Kc) and monocytes (M) in the hepatic sinusoids (sin) and B lymphocytes (B) seem to be no longer involved as in earlier stages. At this stage of tumour cell settlement, rebuilding of the hepatic tissue sets in and soon small visible white spots of metastasis will be seen on the surface of the liver.
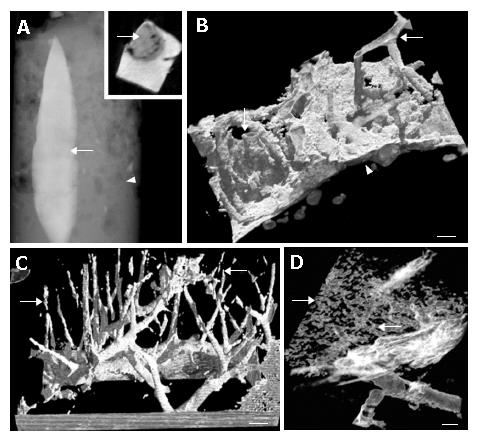
Figure 3 X-ray micro-computed tomography (CT) image set of hepatic tissue.
For detailed recording and subsequent image processing settings we refer to Ananda et al (27). A: Low -magnification data showing an overview of a glutaraldehyde perfused-fixed and subsequently osmium tetroxide/uranyl acetate en bloc stained liver lobule (arrow) versus the unstained sample mounting support (arrowhead). Note, inset shows the corresponding Z-info at an ad random height of the main image; B: X-ray micro CT 3D reconstruction image showing the portal venous blood vessels (arrow) and hepatic tissue (arrowhead); C: X-ray micro CT reconstruction after density histogram image filtering, showing the intricate pattern of hepatic sinusoids (arrow) in 3D context. Note the absence of liver tissue information under this image processing condition (compare with B for the difference); D: Conversely, using different opacity thresholds resulted in the visualization of the hepatic cords, i.e. parenchymal tissue, (arrow). (Courtesy to Ms. S. Ananda and Ms. V. Marsden). Scale Bars (B-D), 500 μm.
- Citation: Braet F, Nagatsuma K, Saito M, Soon L, Wisse E, Matsuura T. The hepatic sinusoidal endothelial lining and colorectal liver metastases. World J Gastroenterol 2007; 13(6): 821-825
- URL: https://www.wjgnet.com/1007-9327/full/v13/i6/821.htm
- DOI: https://dx.doi.org/10.3748/wjg.v13.i6.821


