Copyright
©2007 Baishideng Publishing Group Co.
World J Gastroenterol. Oct 14, 2007; 13(38): 5060-5064
Published online Oct 14, 2007. doi: 10.3748/wjg.v13.i38.5060
Published online Oct 14, 2007. doi: 10.3748/wjg.v13.i38.5060
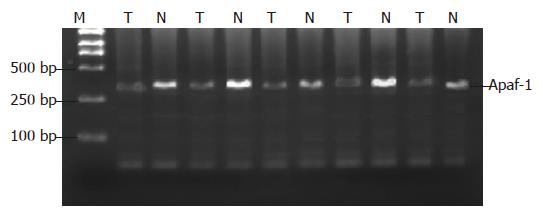
Figure 1 Expression of Apaf-1 mRNA.
M: Marker, T: Tumor, N: Adjacent normal tissue, Apaf-1 mRNA: 334 bp, marker: DL2000.
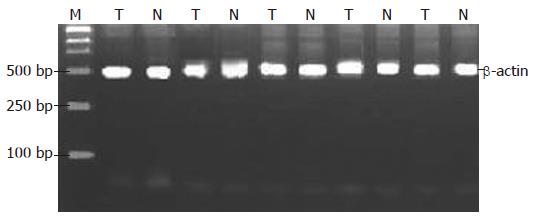
Figure 2 Expression of β-actin mRNA.
M: Marker; T: Tumor; N: Normal adjacent tissue; β-actin mRNA: 498 bp; marker: DL2000.
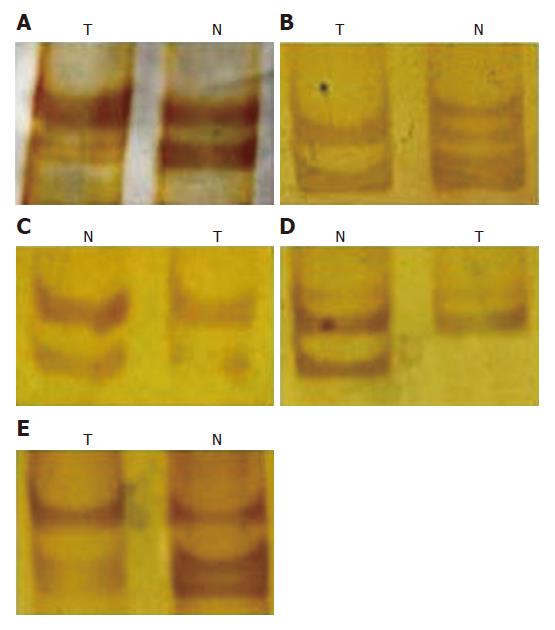
Figure 3 LOH analysis of polymorphic sites of D12S327 (A), D12S1657 (B), D12S393 (C), D12S1706 (D), and D12S346 (E).
T: Tumor tissue; N: Adjacent normal tissue. Silver staining diagram showing Apaf-1 loss and LOH analysis showing allele loss at 5 polymorphic sites of Apaf-1 gene in gastric cancer tissue.
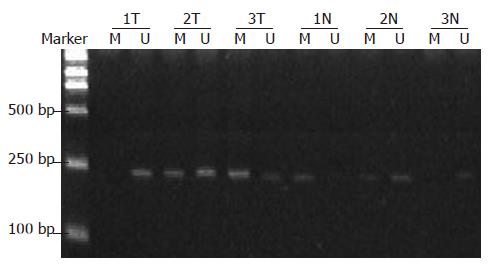
Figure 4 Methylation of Apaf-1 promoter.
M: 212 bp methylation band; U: 221 bp non-methylation band; T: Gastric cancer tissue.
- Citation: Wang HL, Bai H, Li Y, Sun J, Wang XQ. Rationales for expression and altered expression of apoptotic protease activating factor-1 gene in gastric cancer. World J Gastroenterol 2007; 13(38): 5060-5064
- URL: https://www.wjgnet.com/1007-9327/full/v13/i38/5060.htm
- DOI: https://dx.doi.org/10.3748/wjg.v13.i38.5060


