Copyright
©2007 Baishideng Publishing Group Co.
World J Gastroenterol. Oct 7, 2007; 13(37): 4986-4995
Published online Oct 7, 2007. doi: 10.3748/wjg.v13.i37.4986
Published online Oct 7, 2007. doi: 10.3748/wjg.v13.i37.4986
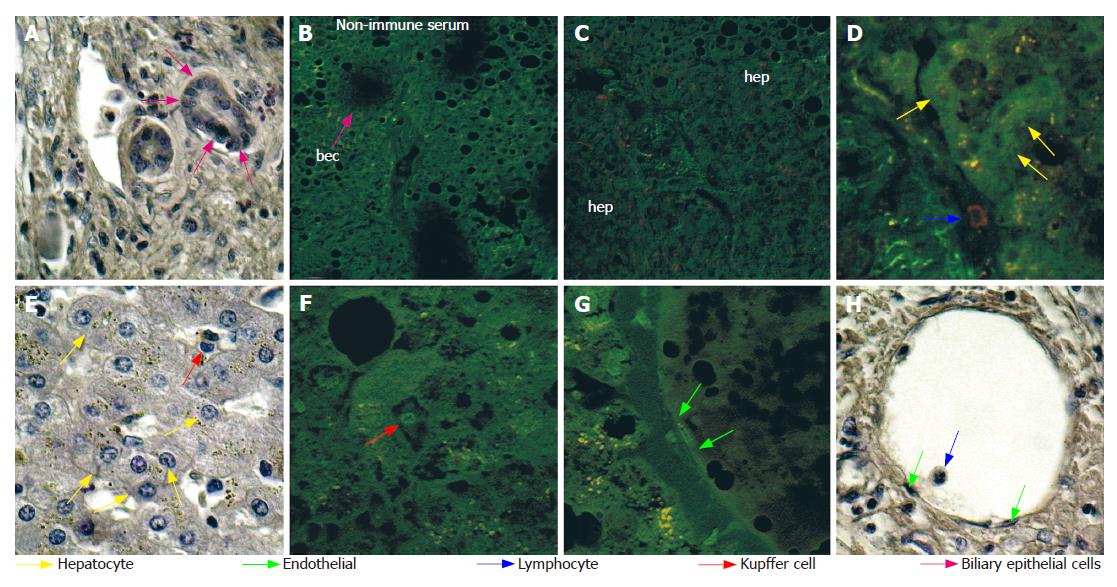
Figure 1 NGF distribution in tissues from healthy donors.
B, C, D, F, G: Confocal microscopy images of immuno-stained sections; in negative hepatocytes, endothelial cells, biliary epithelial cells and Kupffer cells the immunoreaction is the same as the background obtained in control performed by substitution of primary antisera with non-immune rabbit serum; positive immunoreaction (red hue) is only observed on lymphocytes in blood vessels. Green hue represents the auto-fluorescence used to visualize liver tissue morphology; A, E, H: Images of H&E stained sections close to that used for immunohistochemistry. Differently coloured arrows indicate the different cell types (see legend). bec: biliary epithelial cells; hep: hepatocytes.
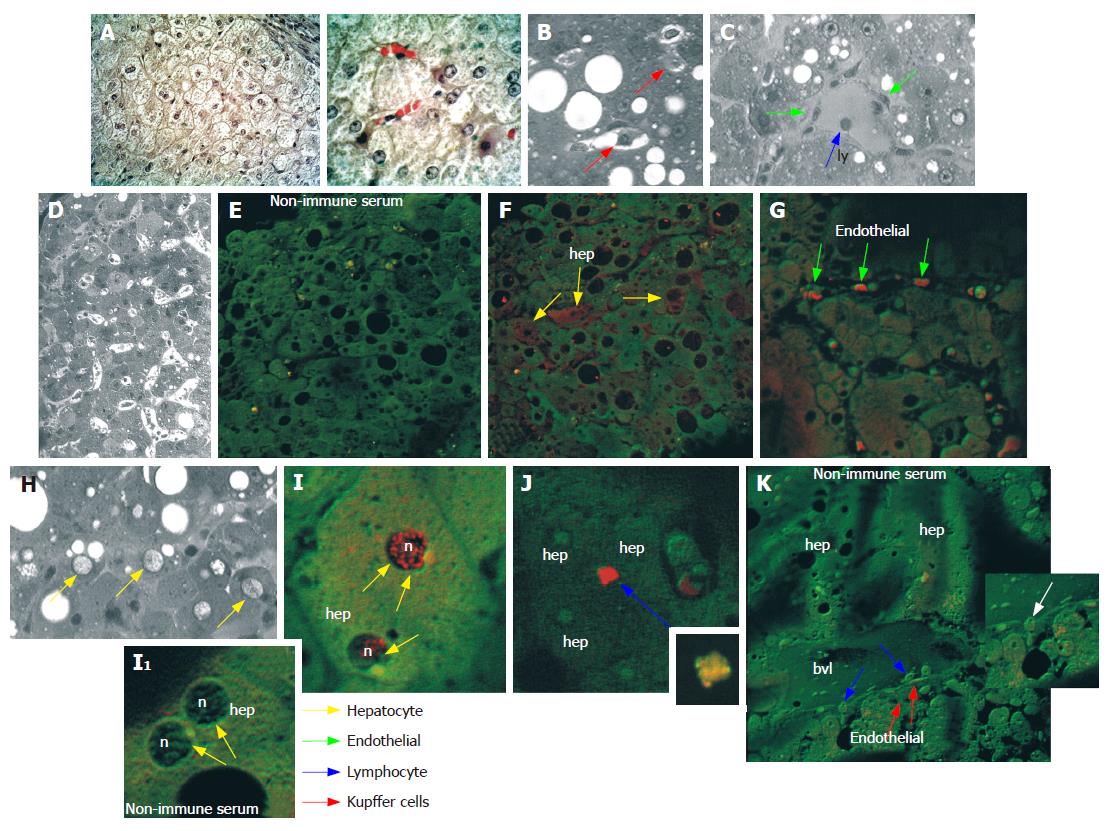
Figure 2 NGF distribution in HCC tissue.
E, F, G, I, J, K: Confocal microscopy images of immuno-stained sections showing NGF immunoreaction (red hue) in the cytoplasm (F) and on nuclei (I) of some hepatocytes, on endothelial cells, on lymphocytes and on Kupffer cells; no immunoreaction was observed in controls performed by substitution of primary antisera with non-immune rabbit serum. A: Images, at two different magnification, of H&E stained sections; B, C, D, H: Images of semithin sections from samples embedded in Spurr epoxy resin. Differently coloured arrows indicate the different cell types (see legend). n: nucleus; hep: hepatocyte; bvl: blood vessel lumen.
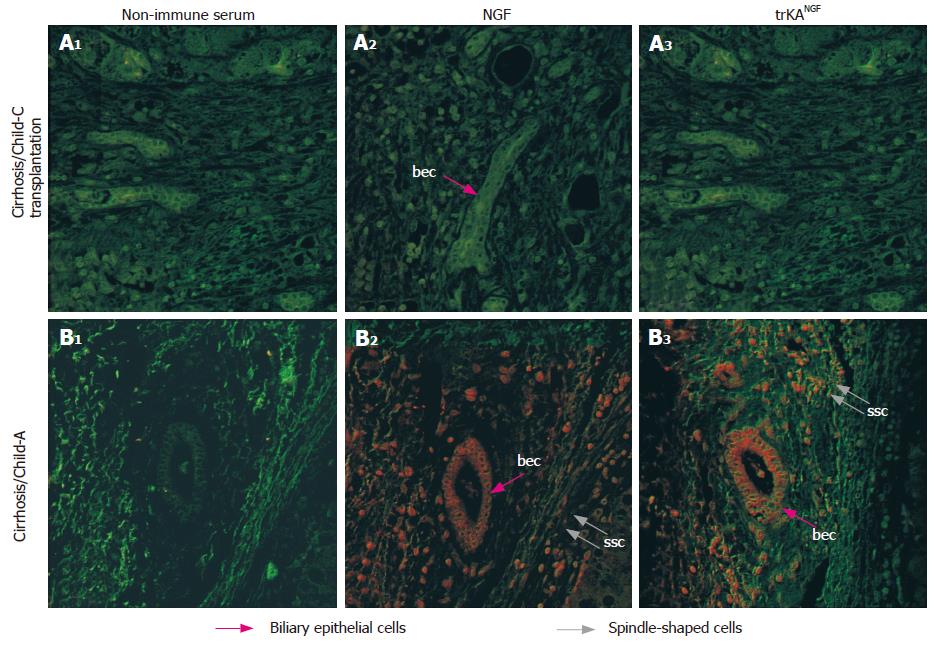
Figure 3 NGF and trkANGF distribution in cirrhotic tissues by confocal microscopy.
A1: Liver specimens obtained before transplantation from patients with cirrhosis but without HCC (Child-Pugh C); A2: NGF distribution; A3: trkANGF distribution; B1: Specimens from patients with cirrhosis, also suffering from HCC, at early staging (Child-Pugh A); B2: NGF distribution; B3: trkANGF distribution. NGF or trkANGF immunoreaction (red hue) is particularly evident on biliary epithelial cells and on spindle-shaped cells, in cirrhotic tissue from patient at early staging (Child-Pugh A), but in presence of HCC, while no immunoreaction is observed in liver specimens resected before transplantation (Child-Pugh C) from patients without HCC. No immunoreaction is observed in controls performed by substitution of primary antisera with non-immune rabbit serum. bec: biliary epithelial cells; ssc: spindle-shaped cells.
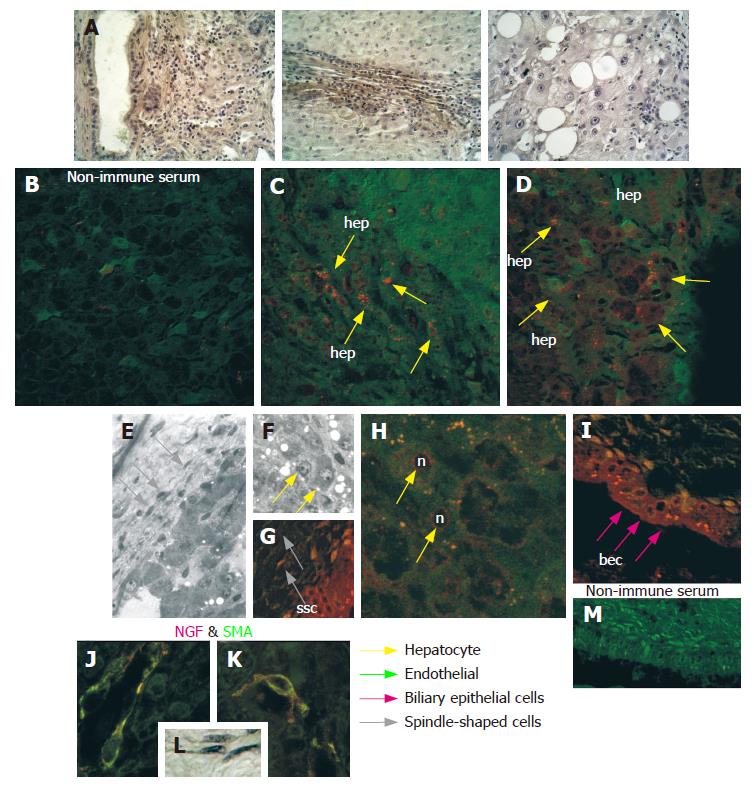
Figure 4 NGF distribution in cirrhotic tissue from patient also suffering from HCC.
B, C, D, G, H, I, M, J, K: Confocal microscopy images of immuno-stained sections showing NGF immunoreaction (red hue) in the cytoplasm of some hepatocytes, on biliary epithelial cells and on spindle-shaped cells; no immunoreaction is observed in controls performed by substitution of primary antisera with non-immune rabbit serum. J, K: Double staining on spindle-shaped cells using anti-NGF and antibody against the myofibroblast marker smooth muscle actin (SMA); A, L: Images of H&E staining; E, F: Images of semithin sections from samples embedded in Spurr epoxy resin. Differently coloured arrows indicate the different cell types (see legend). bec: biliary epithelial cells; n: nucleus; hep: hepatocyte; ssc: spindle-shaped cells.
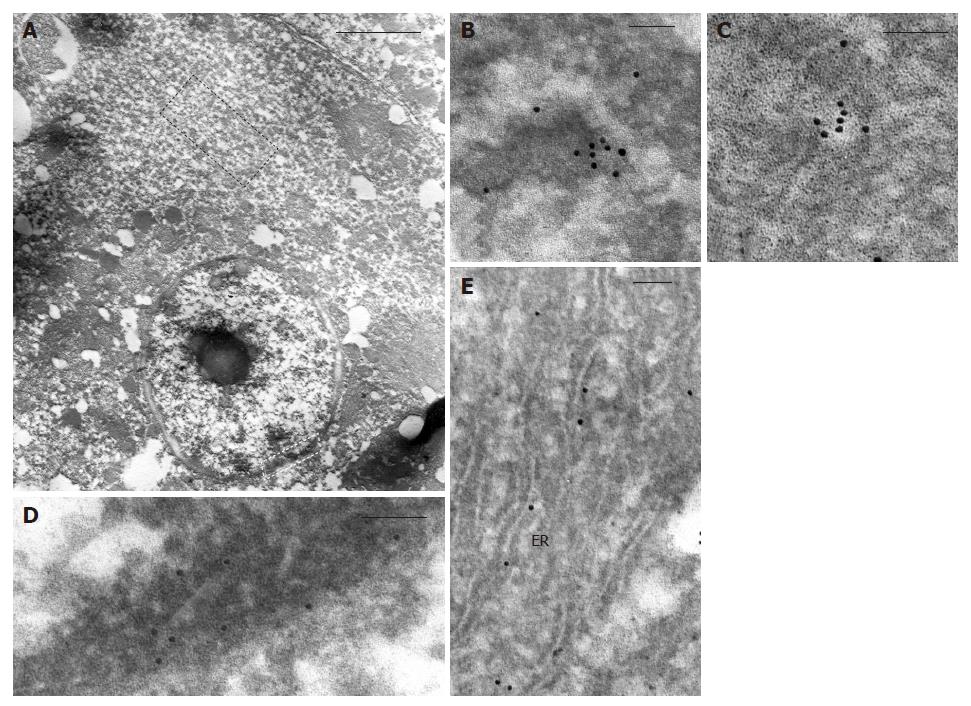
Figure 5 NGF distribution in HCC tissue by immunogold labelling.
A: Transmission electron micrographs of hepatocyte; B, C: Positive immunogold reaction on cytoplasmic vesicles; D: Positive immunogold reaction on nuclei; E: Positive immunogold reaction on endoplasmic reticulum. ER: endoplasmic reticulum. Scale bars = A: 2 μm; B-E: 100 nm.
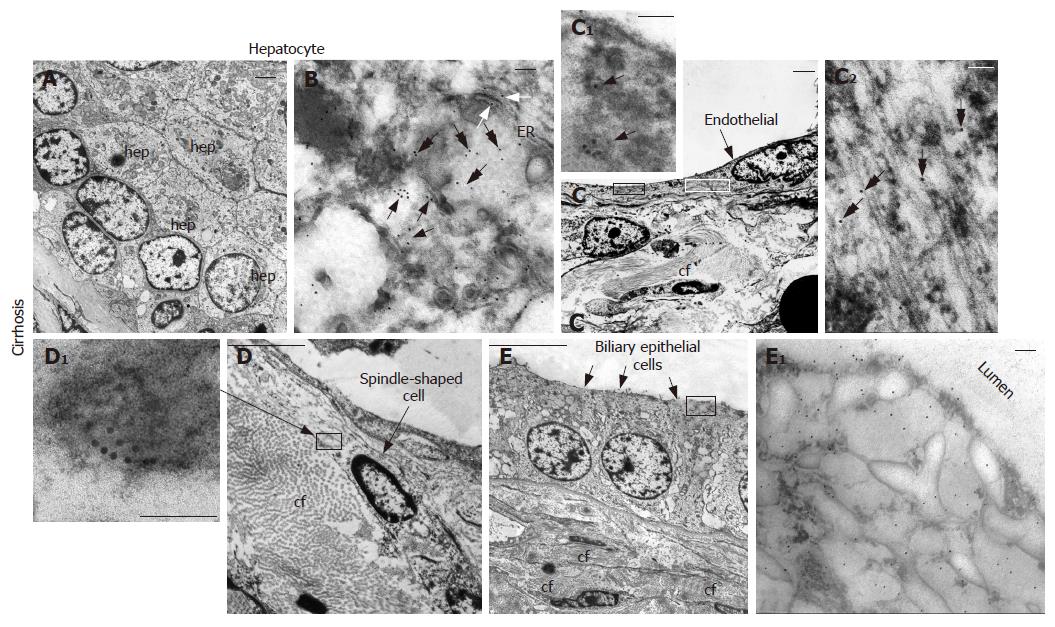
Figure 6 NGF distribution in cirrhotic tissue from patient with HCC by immunogold labelling.
A, B: Transmission electron micrographs of hepatocytes showing positive immunogold reaction on cytoplasmic vesicles (black arrows), free in the cytoplasm (double pointed arrows) and along endoplasmic reticulum (white arrows); C, C1, C2: Endothelial cells; positive immunogold reaction on cytoplasmic vesicles (black arrows) and free in the cytoplasm (double pointed arrows); D, D1: Spindle-shaped cells; E, D1: Biliary epithelial cells. In C1, C2, D1 and E1 details at higher magnification are shown. hep: hepatocytes; cf: collagen fibers; ER: endoplasmic reticulum. Scale bars = A, C, D, E: 2 μm; B, C1, C2, D1, E1: 100 nm.
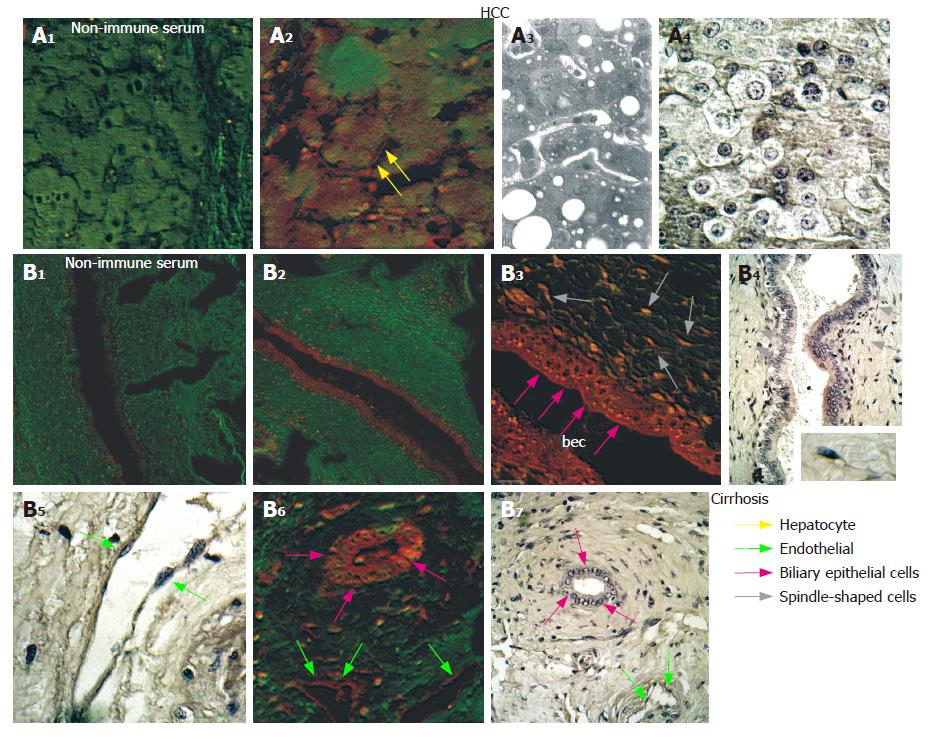
Figure 7 TrkANGF distribution in HCC and cirrhotic tissues.
A: HCC tissue; B: Cirrhotic tissue. A1, A2, B1, B2, B3, B6: Confocal microscopy images of immuno-stained sections. No immunoreaction was observed in controls performed by substitution of primary antisera with non-immune rabbit serum; A4, B4, B5, B7: Images of HE stained sections; A3: Images of semithin section from samples embedded in Spurr epoxy resin. Differently coloured arrows indicate the different cell types (see legend). bec: biliary epithelial cells.
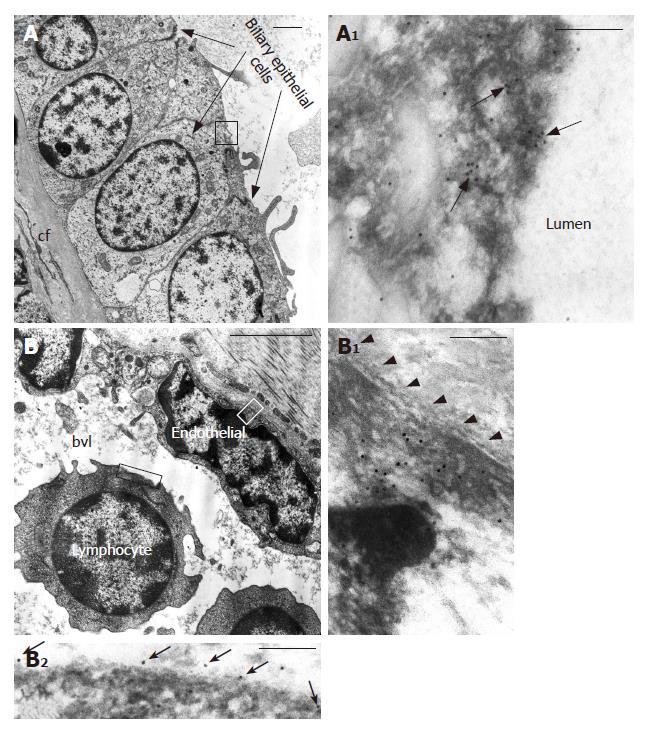
Figure 8 TrkANGF distribution in cirrhotic tissue from patient with HCC by immunogold labeling.
A, A1: Transmission electron micrographs of biliary epithelial cells showing positive immunogold reaction on cell membrane and cytoplasmic vesicles (black arrows) near the ductal lumen; B: Transmission electron micrographs of endothelial cells and lymphocytes; B1: Immunoreactivity free in the cytoplasm of endothelial cells beneath the cell membrane (arrowheads); B2: Gold particles on cell membrane of a lymphocyte. In A1, B1 and B2 details at higher magnification are shown. bvl: blood vessel lumen; cf: collagen fibers. Scale bars = A, B: 2 μm; A1, B1, B2: 200 nm.
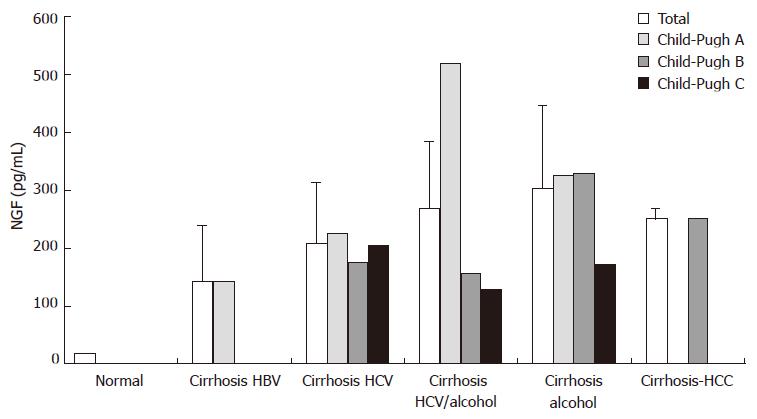
Figure 9 Bar diagram illustrating the circulating NGF levels, determined by test ELISA, in patients with documented cirrhosis/HCC.
NGF amounts, reported with regard to the etiology, is calculated either as mean ± SD (all patients examined) or as mean values for Child-Pugh class A (score = 5-6), for Child-Pugh class B (score = 7-9) and for Child-Pugh class C (score = 10-15). As a control, mean ± SD of circulating NGF levels from some healthy individuals is also reported.
- Citation: Rasi G, Serafino A, Bellis L, Lonardo MT, Andreola F, Zonfrillo M, Vennarecci G, Pierimarchi P, Vallebona PS, Ettorre GM, Santoro E, Puoti C. Nerve growth factor involvement in liver cirrhosis and hepatocellular carcinoma. World J Gastroenterol 2007; 13(37): 4986-4995
- URL: https://www.wjgnet.com/1007-9327/full/v13/i37/4986.htm
- DOI: https://dx.doi.org/10.3748/wjg.v13.i37.4986


