Copyright
©2007 Baishideng Publishing Group Co.
World J Gastroenterol. Jul 28, 2007; 13(28): 3847-3854
Published online Jul 28, 2007. doi: 10.3748/wjg.v13.i28.3847
Published online Jul 28, 2007. doi: 10.3748/wjg.v13.i28.3847
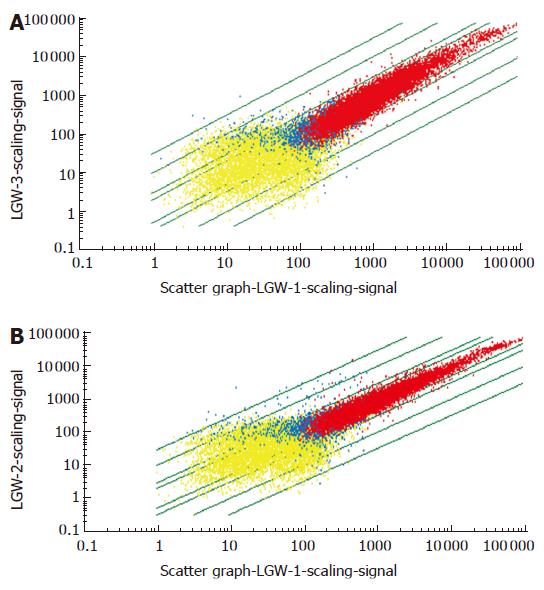
Figure 1 GeneChip scanning scatter graph.
A: 4-h plasmid group; B: 18-h plasmid group. Genes which were not expressed are listed in yellow, genes which were expressed are listed in red, and genes which were between expressed and not-expressed are listed in blue.
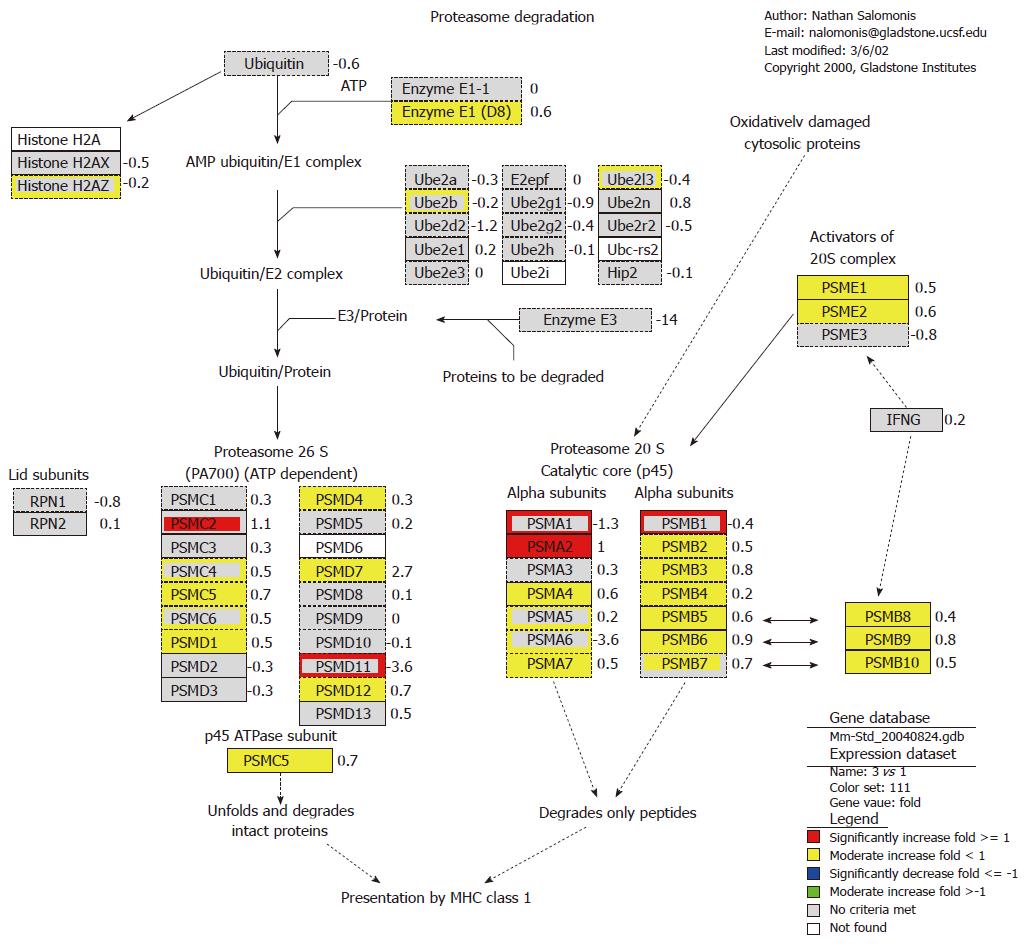
Figure 2 Effect of orally administered foreign plasmid pDNA3 on proteasome degradation pathway.
Genes which were up-regulated in response to plasmid pcDNA3 are listed in red (SLR > 1) and yellow (0 < SLR < 1), and genes which were down-regulated are listed in blue (SLR < -1) and green (-1 < SLR < 0). Pathway is defined by GenMAPP (http://www.GenMAPP.org).
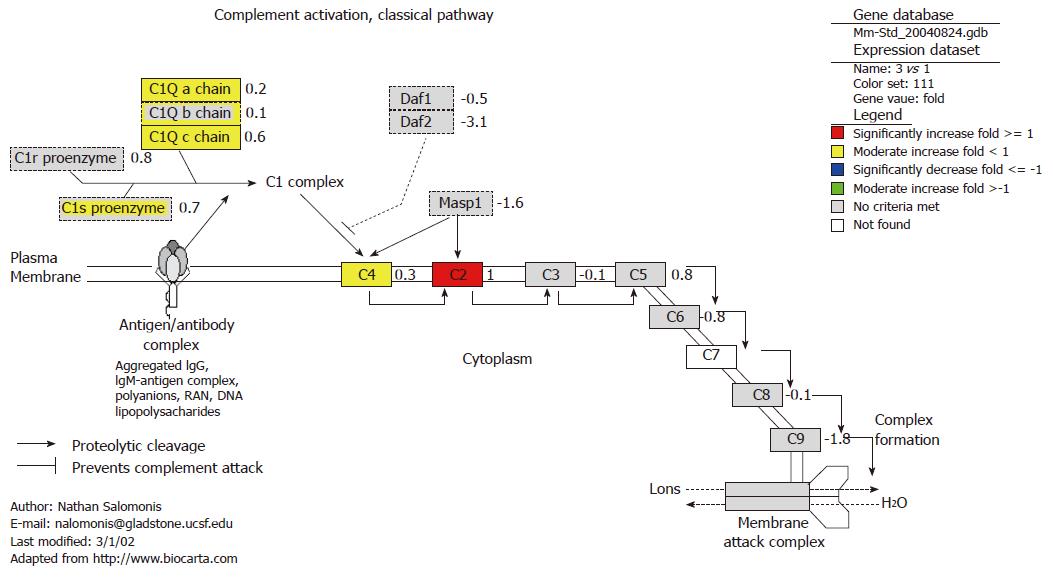
Figure 3 Effect of oral foreign plasmid pcDNA3 on complement activation classical pathway.
The details defined are consistent with Figure 1.
- Citation: Liu JW, Cheng J. Molecular mechanism of immune response induced by foreign plasmid DNA after oral administration in mice. World J Gastroenterol 2007; 13(28): 3847-3854
- URL: https://www.wjgnet.com/1007-9327/full/v13/i28/3847.htm
- DOI: https://dx.doi.org/10.3748/wjg.v13.i28.3847


