©2007 Baishideng Publishing Group Inc.
World J Gastroenterol. Jul 14, 2007; 13(26): 3619-3624
Published online Jul 14, 2007. doi: 10.3748/wjg.v13.i26.3619
Published online Jul 14, 2007. doi: 10.3748/wjg.v13.i26.3619
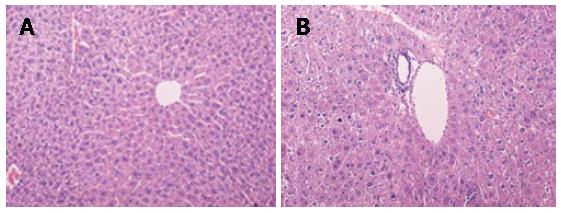
Figure 1 Microscope graphs of mice liver slices.
A: control group; B: Leigongteng group (HE, × 200).
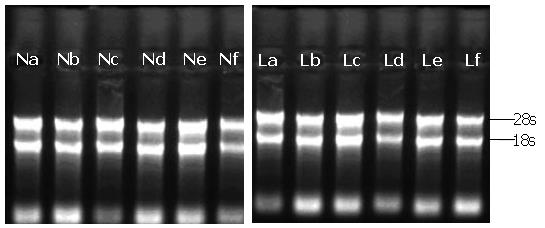
Figure 2 Total RNA showed by agarose gel electrophoresis.
Na-Nf: control group, La-Lf: Leigongteng-treating group.
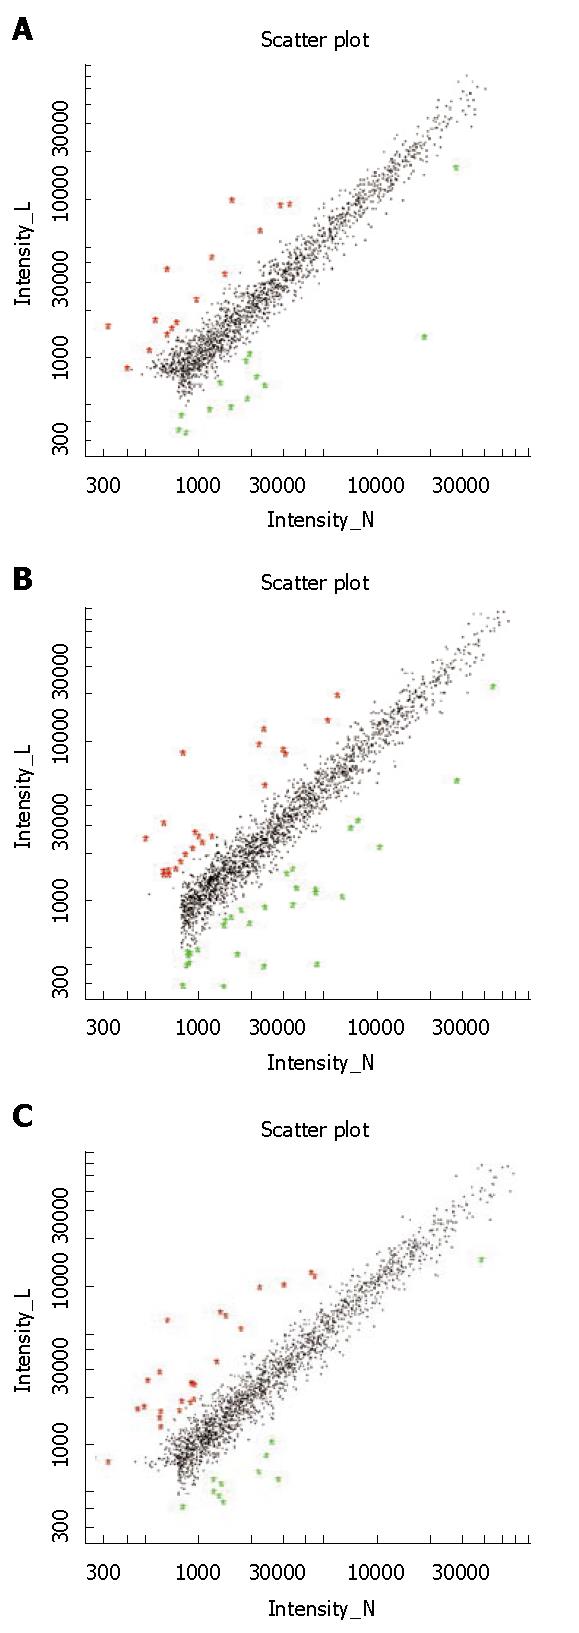
Figure 3 Scatter plot analysis of expression ratio.
A and B: obversely labeled microarray; C: reversely labeled microarray.
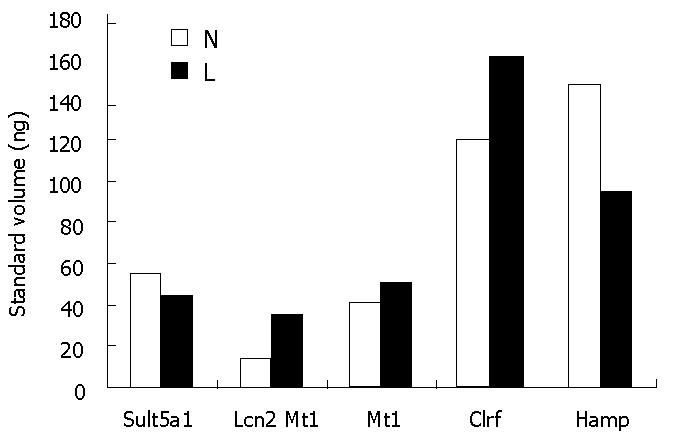
Figure 4 RT-PCR analyses of 5 differentially expressed genes.
- Citation: Chen Y, Zhang XM, Han FM, Du P, Xia QS. Gene expression profile analyses of mice livers injured by Leigongteng. World J Gastroenterol 2007; 13(26): 3619-3624
- URL: https://www.wjgnet.com/1007-9327/full/v13/i26/3619.htm
- DOI: https://dx.doi.org/10.3748/wjg.v13.i26.3619


