©2007 Baishideng Publishing Group Inc.
World J Gastroenterol. Jul 14, 2007; 13(26): 3598-3604
Published online Jul 14, 2007. doi: 10.3748/wjg.v13.i26.3598
Published online Jul 14, 2007. doi: 10.3748/wjg.v13.i26.3598
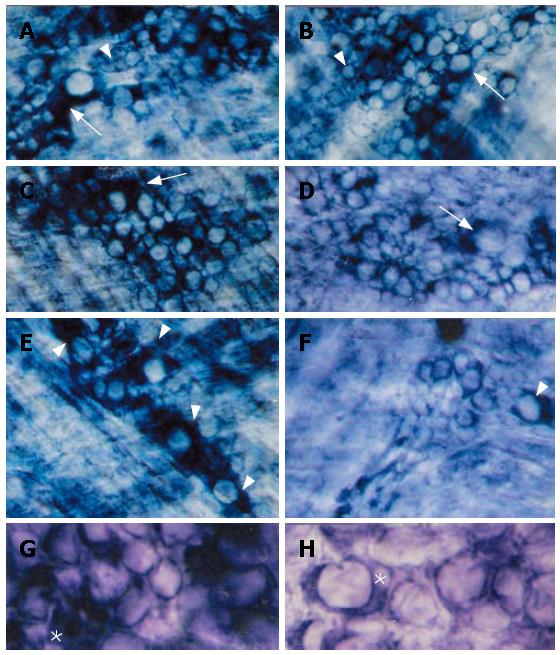
Figure 1 Myenteric neurons stained for NADH diaphorase in esophagi taken from N (A, C, E, G) and D (B, D, F, H) rats.
In both groups small (arrowheads) and large (arrows) neurons are evident (A, B). Sometimes large neurons were only weakly stained, such as in C and D (arrows) and G and H (*). the weakness of staining in large neurons; E, F: On the other hand, in N animals (E) large and intensely reactive neurons predominated (arrowheads), but their number was largely reduced inside D ganglia (F, arrowhead) (A-F: x 340; G and H: x 715).
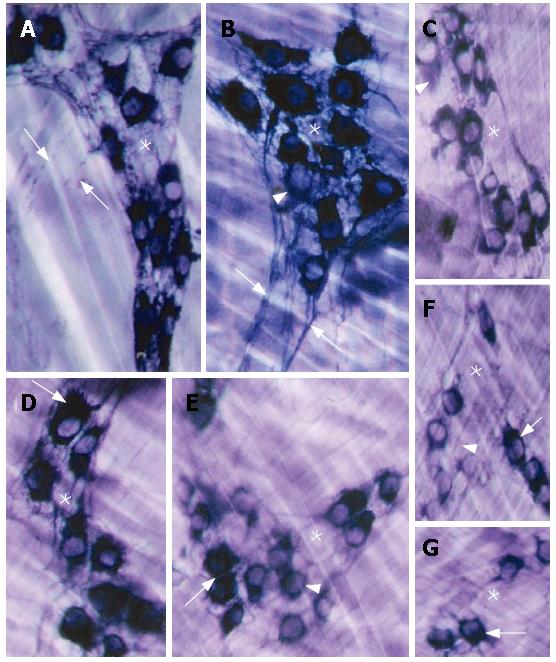
Figure 2 Myenteric neurons of the esophagus taken from N (A, B, D) and D (C, E, F, G) rats, stained with the NADPH diaphorase method.
Bundles of axons and varicosities of reactive neurons (arrows) are well-evidenced in N group (A, B). The space inside ganglia (*) with non-reactive neurons detected in both groups are wider in D (C, E-G) while in N a thin network of neuronal processes is evidenced (A, B, D). Both groups show reactive neurons (arrows) with irregular contours (C-G). Some neurons featured moderately intense staining both in N and D (B, C, E, F). (A-G: x 340).
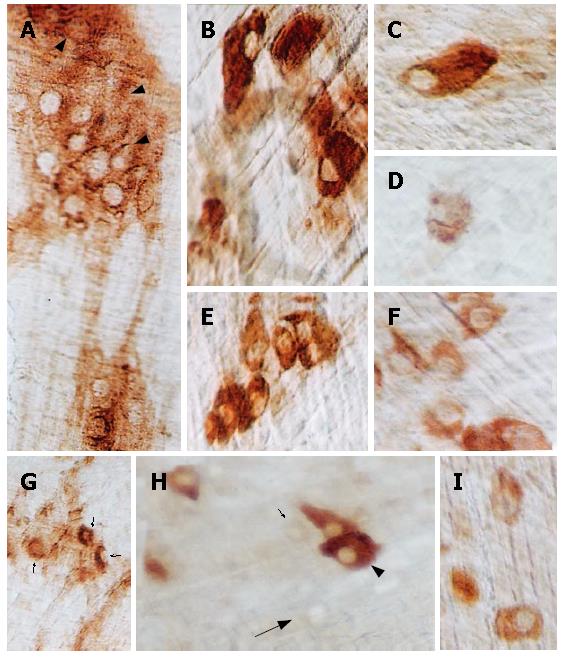
Figure 3 Myenteric plexus of the esophagus from N (A-C, E) and D (D, F-I) rats stained with the AChE technique.
Most N neurons react intensely (A, arrowheads, and B, C, E) while only a few neurons in D are strongly reactive (G, small arrows, and D, F, I). Furthermore, a wide range of staining intensity was observed in some D ganglia, from very intense (H, arrowhead) to poor (H, small arrow). Non-reactive neurons (“shadows”) were also observed in this group (H, large arrow). (A-F, H and I: x 340; G: x 120).
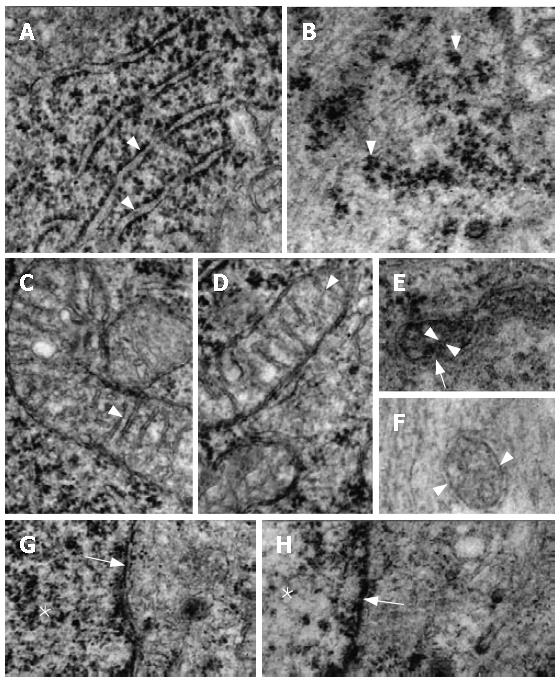
Figure 4 Electron micrographs of myenteric neurons.
A: Granular reticulum of N with the ribosomes aligned on the outer surface of the regularly-arranged membrane (arrowheads); B: Characteristic disposition of the ribosomes in clusters in D animals (arrowheads); C, D: Normal aspects of the mitochondria of N with typical transversal cristae (arrowheads); E: A electron-dense mitochondrium of N with normal double membrane (arrow) and a obliquely-oriented crista (arrowheads); F: Transversal section of a mitochondrium of D. Note the double membrane preserved (arrowheads); G: Nuclear chromatin (*) and nuclear membrane (arrow) of N; H: The same aspects in a D neuron. Compare the distribution of the nuclear chromatin (*) with a N specimen (G). (A-D: x 40000; E, F: x 60000; G and H: x 30000).
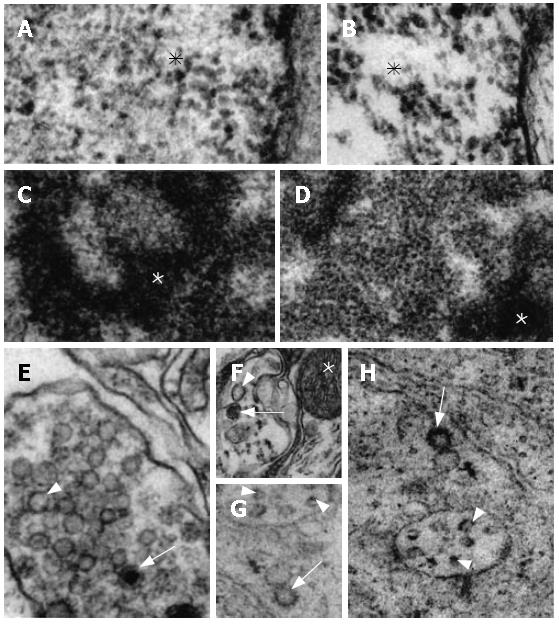
Figure 5 Electron micrographs of myenteric neurons of esophagus.
A, B: High magnification photomicrograph of the nuclear chromatin (*) in N (A) and D (B) neurons. Clear spaces are evident in the nucleus of D; C, D: Granular component (*) of N and D nucleoli. Note the more electron-dense aspect of this nucleolar part in N; E, F: Granular vesicles with a electron-dense core (arrows) and well-defined agranular vesicles (arrowheads) of N. Note a preserved mitochondrium (*); G, H: Large (arrows) and small (arrowheads) granular vesicles of D. Note the absence of an electron-dense core. (A-C: x 75000; D, E, G, H: x 60000; F: x 40000).
- Citation: Liberti EA, Fontes RB, Fuggi VM, Maifrino LB, Souza RR. Effects of combined pre- and post-natal protein deprivation on the myenteric plexus of the esophagus of weanling rats: A histochemical, quantitative and ultrastructural study. World J Gastroenterol 2007; 13(26): 3598-3604
- URL: https://www.wjgnet.com/1007-9327/full/v13/i26/3598.htm
- DOI: https://dx.doi.org/10.3748/wjg.v13.i26.3598


