©2007 Baishideng Publishing Group Inc.
World J Gastroenterol. Jul 7, 2007; 13(25): 3493-3499
Published online Jul 7, 2007. doi: 10.3748/wjg.v13.i25.3493
Published online Jul 7, 2007. doi: 10.3748/wjg.v13.i25.3493
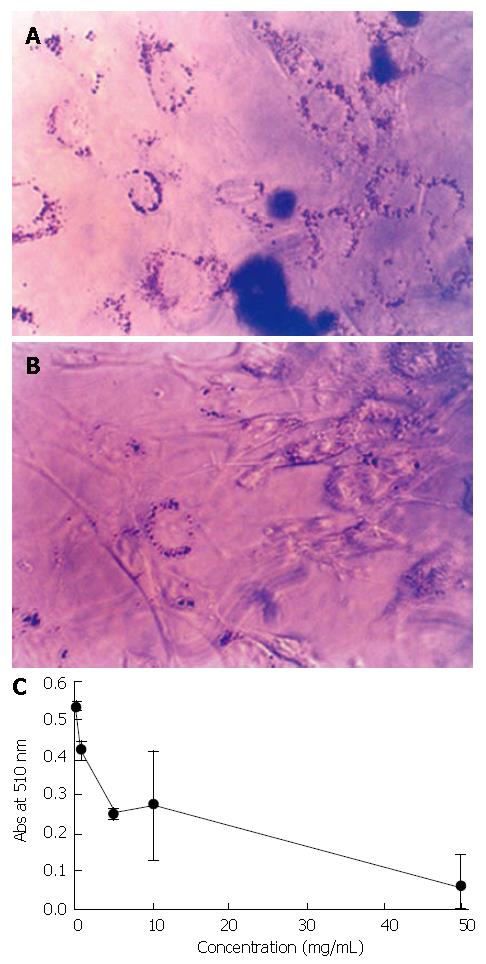
Figure 1 PGE inhibited preadipocyte differentiation in a dose-dependent manner.
Fully differentiated 3T3-L1 cells both non-treated (A) and treated (B) with PGE were stained with Oil red O staining solution. The absorbencies at 510 nm from 3T3-L1 cells treated with various concentrations of PGE (C).
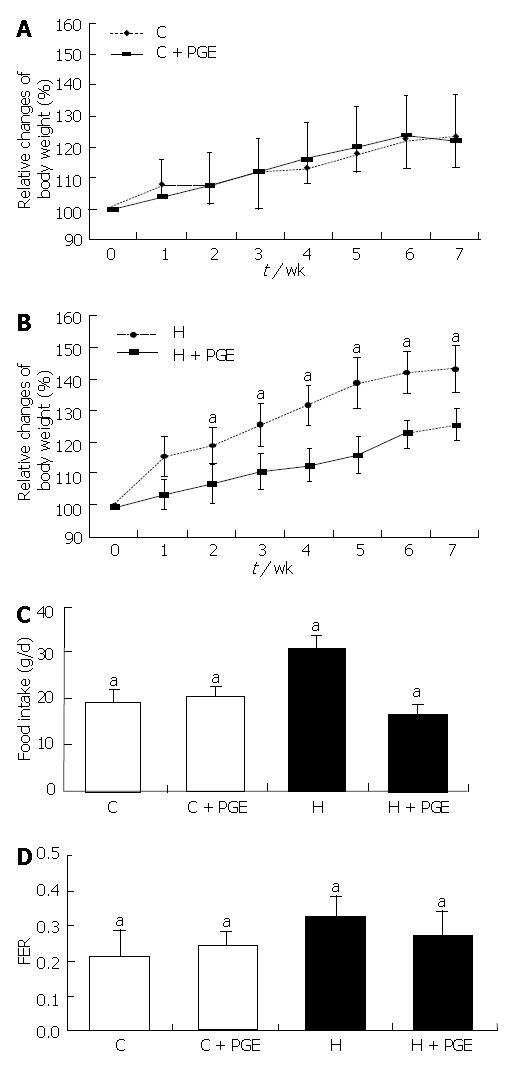
Figure 2 Effects of PGE on body weight of rats fed experimental diet for 7 wk.
C: Control normal fat diet group (n = 10); H : 30% lard containing high fat diet group (n = 10); C + PGE : Control rats orally administered 150 mg/100 g body weight of Platycodon grandiflorum extract (PGE) group (n = 10); H + PGE: High fat feeding with administered PGE orally at the concentration of 150 mg/100 g body weight group (n = 10). Values are mean ± SE. They were compared using the ANOVA and post Tukey test. P < 0.05 was considered statistically significant.
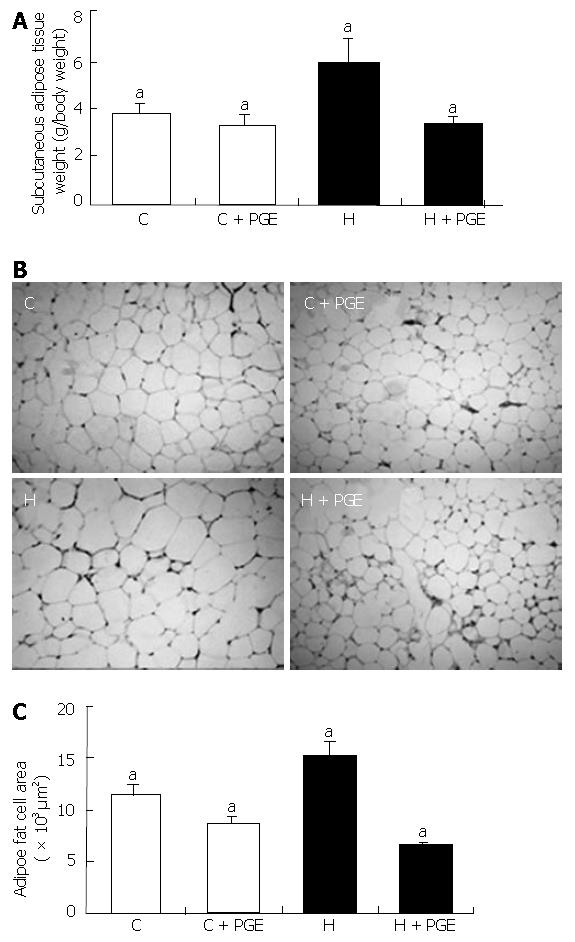
Figure 3 Effects of PGE on subcutaneous adipose tissue weight and adipocyte cell area.
At the end of experiment, all the animals were sacrificed and subcutaneous adipose tissue was isolated, weighed (A), cryosectioned (B), and fat cell area was measured (C). C: The control normal fat diet group (n = 10); H: 30% lard containing high fat diet group (n = 10); C + PGE: Control rat orally administered 150 mg/100 g body weight of Platycodon grandiflorum extract (PGE) group (n = 10); H + PGE: High fat feeding with orally administered PGE at the concentration of 150 mg/100 g body weight group (n = 10). Values are mean ± SE. They were compared using the ANOVA and post Tukey test. P < 0.05 was considered statistically significant.
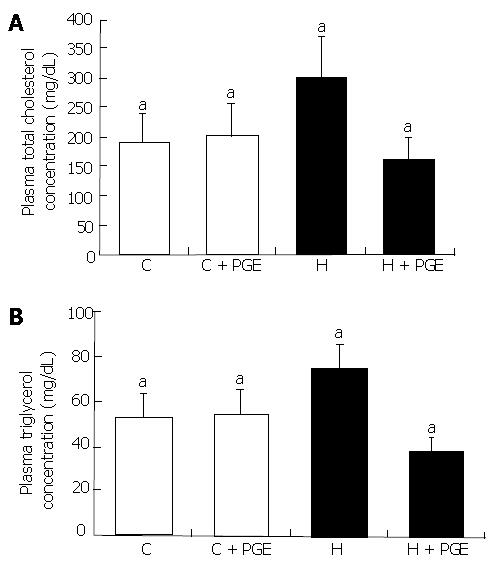
Figure 4 Effects of PGE on the plasma TC and TG concentrations of obese rats.
C: Control normal fat diet group (n = 10); H: 30% lard containing high fat diet group (n = 10); C + PGE: Control rats orally administered 150 mg/100 g body weight of PGE group (n = 10); H + PGE: High fat feeding with administered PGE orally at the concentration of 150 mg/100 g body weight group (n = 10). Values are mean ± SE. They were compared using the ANOVA and post Tukey test. P < 0.05 was considered statistically significant.
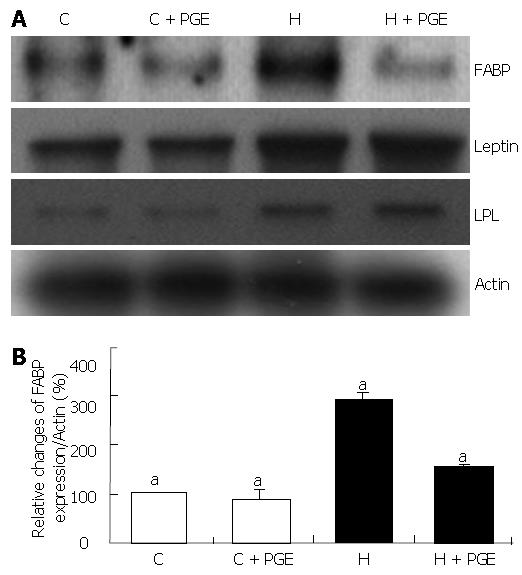
Figure 5 FABP and other adipogeneic marker gene expressions in subcutaneous adipose tissue.
The total RNA in subcutaneous adipose tissue was isolated with Trizol reagent and 10 mg of RNA was used for Northern hybridization. C: Control normal fat diet group (n = 10); H: 30% lard containing high fat diet group (n = 10); C + PGE: Control rats orally administered 150 mg/100 g body weight of PGE group (n = 10); H + PGE: High fat feeding with simultaneously administered PGE orally at the concentration of 150 mg/100 g body weight group (n = 10). Values are mean ± SE. They were compared using the ANOVA and post Tukey test. P < 0.05 was considered statistically significant.
-
Citation: Park YS, Yoon Y, Ahn HS.
Platycodon grandiflorum extract represses up-regulated adipocyte fatty acid binding protein triggered by a high fat feeding in obese rats. World J Gastroenterol 2007; 13(25): 3493-3499 - URL: https://www.wjgnet.com/1007-9327/full/v13/i25/3493.htm
- DOI: https://dx.doi.org/10.3748/wjg.v13.i25.3493


