Copyright
©2007 Baishideng Publishing Group Co.
World J Gastroenterol. Jun 28, 2007; 13(24): 3342-3349
Published online Jun 28, 2007. doi: 10.3748/wjg.v13.i24.3342
Published online Jun 28, 2007. doi: 10.3748/wjg.v13.i24.3342
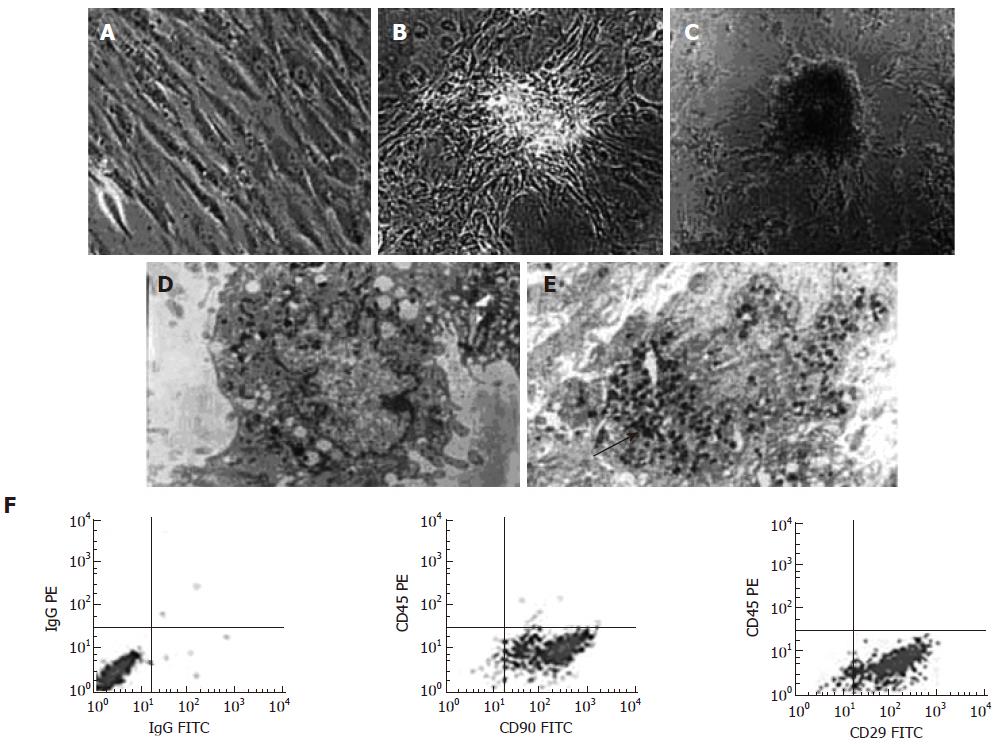
Figure 1 Morphological changes of BM-MSCs during differentiation.
A: The third passage of pre-induced BM-MSCs (× 500); B: BM-MSCs formed islet-like clusters under 5% FBS HG-DMEM culture (× 500); C: Some clusters were half suspended in the culture medium after induced by nicotinamide and exendin-4 (× 500); Electron microscopy: Secretory granules (the black arrow shows) are densely packed within the cytoplasm of D-MSCs (E, × 4000) whereas few is found in pre-induced BM-MSCs (D × 5000); F: Surface markers of BM-MSCs showed that CD90 and CD29 positive rates were more than 93% whereas CD45 expressions were less than 1%.
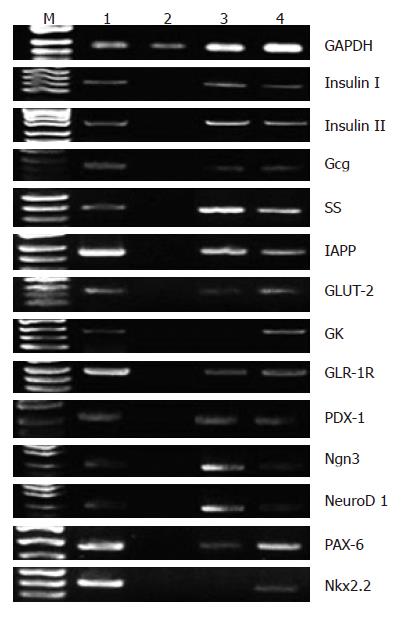
Figure 2 Gene expressions during BM-MSCs differentiation.
M DNA marker: 1 Rat pancreas; 2 Pre-induced BM-MSCs; 3 BM-MSCs in 5% FBS HG-DMEM culture; 4 BM-MSCs in 5% FBS HG-DMEM culture with nicotinamide and exendin-4.
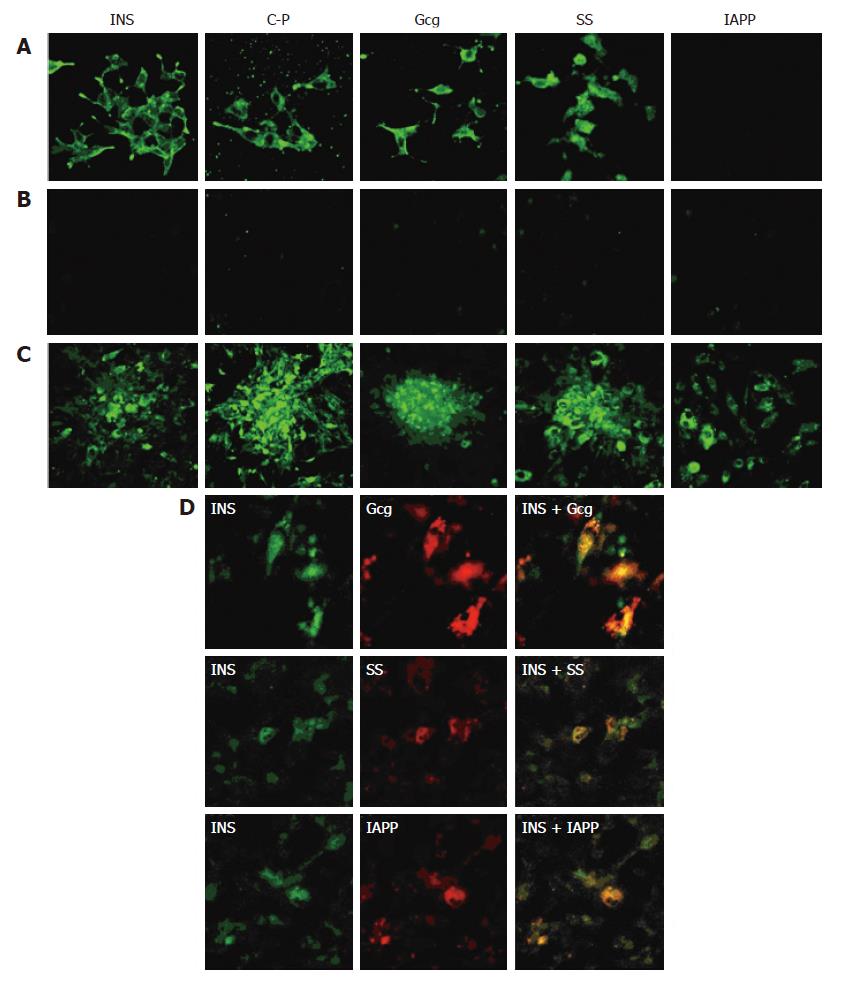
Figure 3 Immunofluorescence reveals BM-MSCs differentiated into islet-like cells in vitro.
Rat RIN-m5F cells displayed insulin (INS), C-peptide (C-P), glucagons (Gcg), somatostatin (SS), but without islet amyloid polypeptide (IAPP) (A, × 400); Pre-induced BM-MSCs were negative for the above islet hormones staining (B, × 400); D-MSCs showed the staining of INS, C-P, Gcg, SS, IAPP (C, × 400); Some D-MSCs co-expressed INS/Gcg, INS/SS, INS/IAPP (D, × 400).
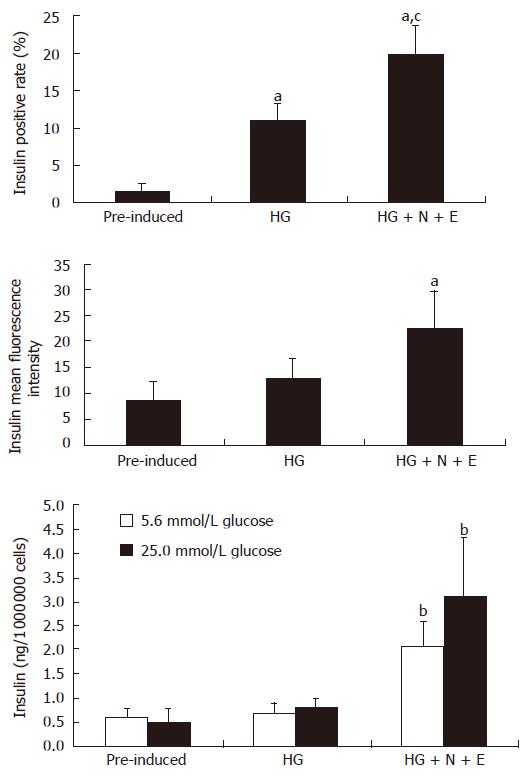
Figure 4 Insulin content and release in response to glucose stimulation of BM-MSCs in different groups.
Insulin positive rate of D-MSCs was up to around 19.8% and mean fluorescence intensity was increased by 2.6 folds, which was significantly higher than that of pre-induced BM-MSCs. D-MSCs secreted a small amount of insulin into medium and the insulin was increased by 1.5 folds under the glucose challenge. aP < 0.05 vs pre-induced BM-MSCs; cP < 0.05 vs HG; bP < 0.01 vs other group. N: nicotinamide; E: exendin-4.
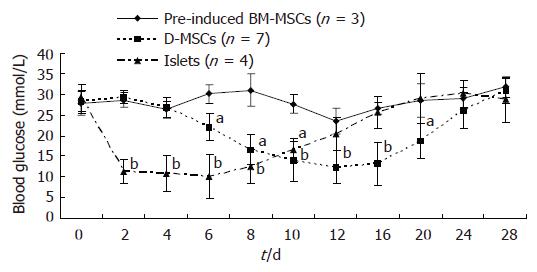
Figure 5 Glucose change of STZ-induced diabetic rats after D-MSCs transplantation via portal vein.
Glucose levels in the D-MSCs implanted rats began to decrease at d 6 following transplantation, kept below 15 mmol/L during d 12 to d 16, and then elevated again after d 20. In contrast, glucose levels in islets implanted rats decreased at d 2, kept below 15mmol/L during d 4 to d 8, and then elevated again after d 10. Glucose levels in the pre-induced BM-MSCs implanted rats remained elevated. aP < 0.05, bP < 0.01 vs pre-induced BM-MSCs implanted rats.
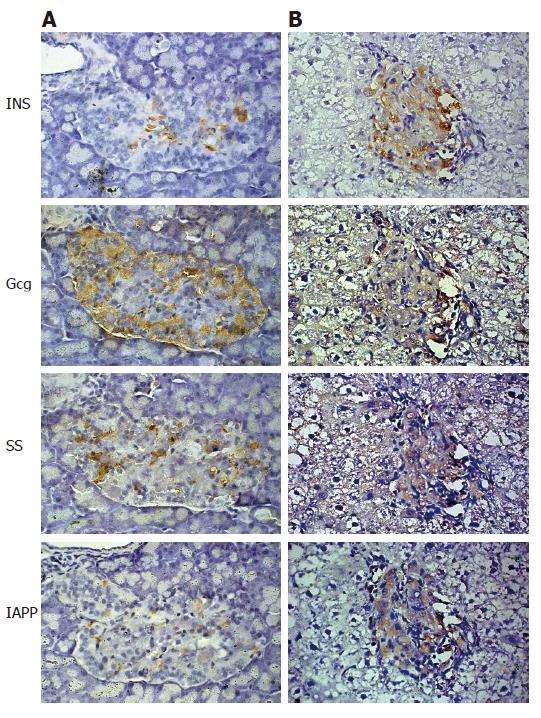
Figure 6 Islet hormones expression in the pancreas and liver of STZ-induced diabetic rat after D-MSCs transplantation via portal vein.
D-MSCs grafts were located in the liver (B, × 400), expressing insulin (INS), glucagons (Gcg), somatostatin (SS) and islet amyloid polypeptide(IAPP); In the remaining pancreatic islets, a few insulin-expressing cells located in the center, rich Gcg-expressing cells setting at the periphery, a few SS-expressing cells and IAPP-expressing cells scattering in the islets (A, × 400).
- Citation: Wu XH, Liu CP, Xu KF, Mao XD, Zhu J, Jiang JJ, Cui D, Zhang M, Xu Y, Liu C. Reversal of hyperglycemia in diabetic rats by portal vein transplantation of islet-like cells generated from bone marrow mesenchymal stem cells. World J Gastroenterol 2007; 13(24): 3342-3349
- URL: https://www.wjgnet.com/1007-9327/full/v13/i24/3342.htm
- DOI: https://dx.doi.org/10.3748/wjg.v13.i24.3342


