Copyright
©2006 Baishideng Publishing Group Co.
World J Gastroenterol. Feb 28, 2006; 12(8): 1235-1242
Published online Feb 28, 2006. doi: 10.3748/wjg.v12.i8.1235
Published online Feb 28, 2006. doi: 10.3748/wjg.v12.i8.1235
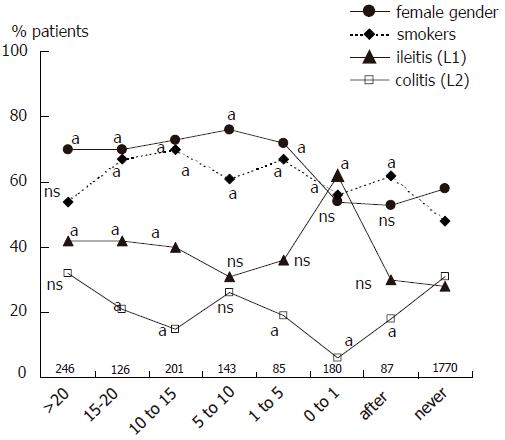
Figure 1 Characteristics of patients and Crohn’s disease (given as percentages) according to appendectomy status and the time span between appendectomy and diagnosis of Crohn’s disease.
Numbers indicate the number of patients in each group. a and ns represent the P value of the comparison between the subgroup and the group of never appendectomized patients (aP < 0.05; ns: not significant).
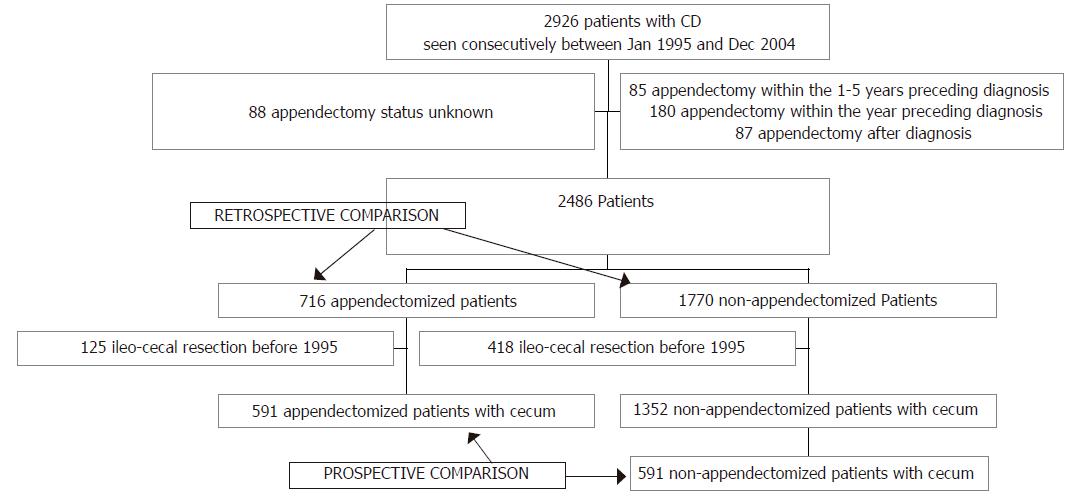
Figure 2 Flow chart of patients studied.
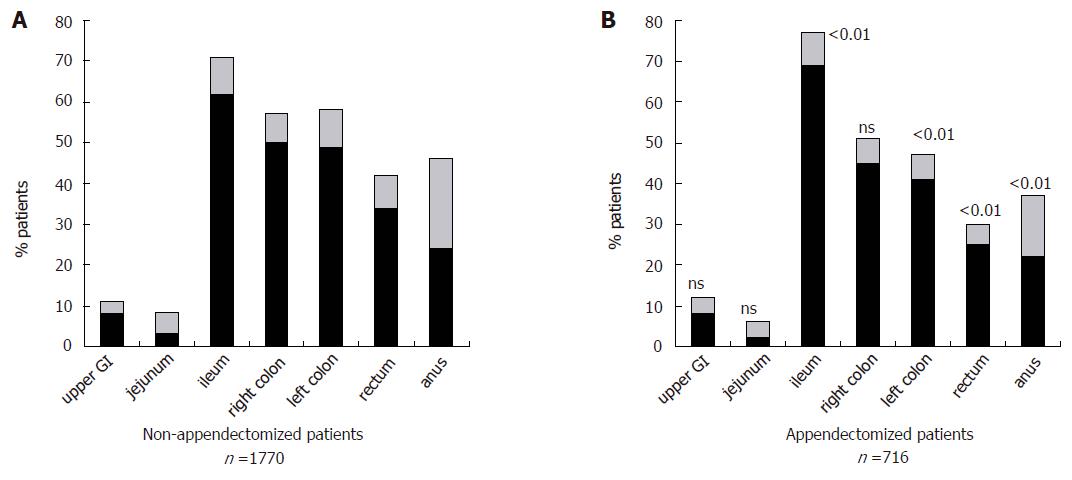
Figure 3 Initial and cumulative Crohn’s disease involvement of various segments of the digestive tract in non-appendectomized and appendectomized patients.
The numbers above the columns indicate the P values comparing the frequencies of cumulative involvement of each segment between the two groups.
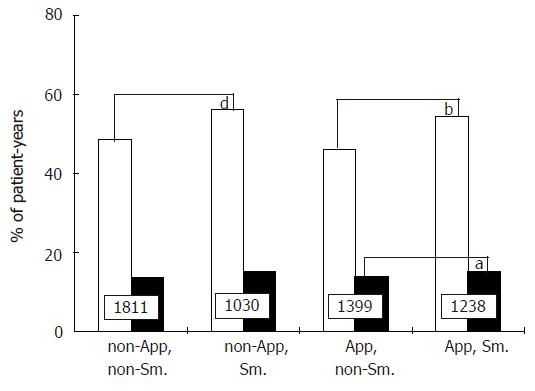
Figure 4 Percentages of patient-years with active disease (grey columns) and hospitalization (black columns), respectively, according to appendectomy and smoking status (App: appendectomized; Sm: smokers).
Numbers indicate the number of patient-years in each group. aP < 0.05 vs App, non-Sm.; bP < 0.001 vs App, non-Sm.; dP < 0.001 vs non-App, non-Sm.
- Citation: Cosnes J, Seksik P, Nion-Larmurier I, Beaugerie L, Gendre JP. Prior appendectomy and the phenotype and course of Crohn’s disease. World J Gastroenterol 2006; 12(8): 1235-1242
- URL: https://www.wjgnet.com/1007-9327/full/v12/i8/1235.htm
- DOI: https://dx.doi.org/10.3748/wjg.v12.i8.1235


