Copyright
©2006 Baishideng Publishing Group Co.
World J Gastroenterol. Dec 28, 2006; 12(48): 7878-7883
Published online Dec 28, 2006. doi: 10.3748/wjg.v12.i48.7878
Published online Dec 28, 2006. doi: 10.3748/wjg.v12.i48.7878
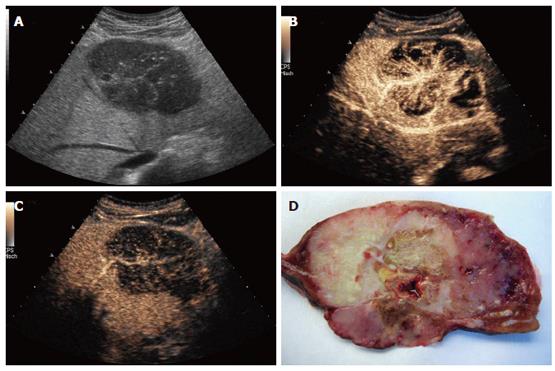
Figure 1 Patient 1: Osteoclastic giant cell tumor of the liver: A: B-mode sonography (HDI 5000, Philips), contrast sonography during the B: arterial and C: portal phase (Siemens); D: resected tumor: cut surface shows distinct tumor areas with necrotic and hemorrhagic regions.
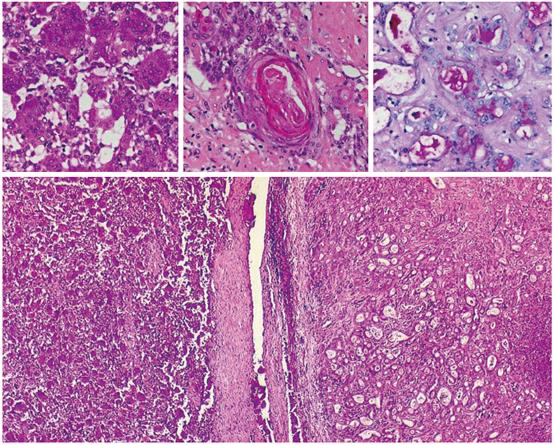
Figure 2 Histology (HE, x 20-40) of OGCT of the liver with a mixed cell population of osteoclastic giant cells and pleomorphic mononuclear cells (left), adenocarcinomatous component with mucinous inclusions (PAS, upper right) and squamous cell differentiation (middle).
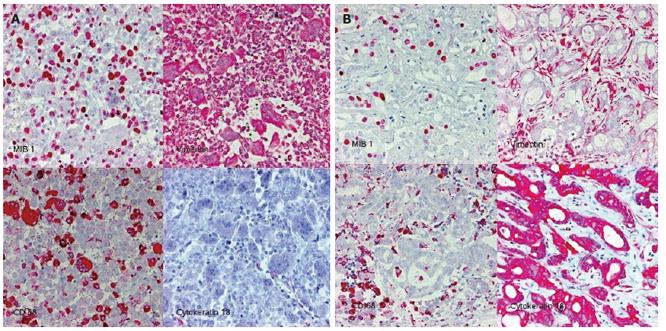
Figure 3 Immunohistology of the OGCT of the liver.
Panel A: mixed cell population of osteoclastic giant cells and pleomorphic mononuclear cells. CD68: histio-monocytic differentiation of osteoclastic giant cells, MIB 1: proliferation of mononuclear cells. Panel B: adenocarcinomatous component with mucinous inclusions: CK18+, CD68/vimentin: -.
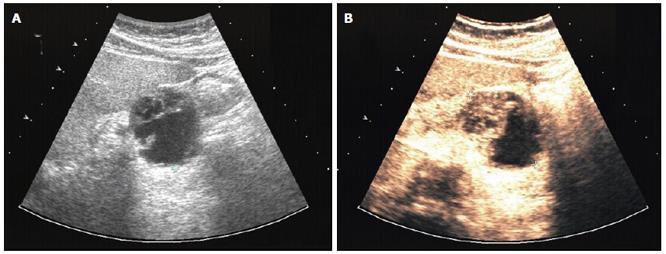
Figure 4 Patient 2: osteoclastic giant cell tumor of the pancreas.
A: B-mode (HDI 5000, Philips) and B: contrast sonography (Sonovue®, low MI/CPS, Acuson Sequoia 512).
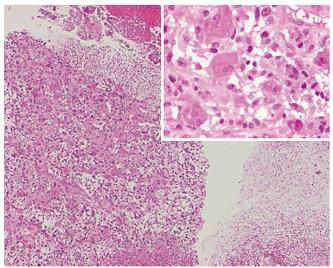
Figure 5 Histology (HE, x 20-40) of OGCT of the pancreas with a mixed cell population of osteoclastic giant cells and pleomorphic mononuclear cells (left) and myxoid tumor areas (right).
- Citation: Bauditz J, Rudolph B, Wermke W. Osteoclast-like giant cell tumors of the pancreas and liver. World J Gastroenterol 2006; 12(48): 7878-7883
- URL: https://www.wjgnet.com/1007-9327/full/v12/i48/7878.htm
- DOI: https://dx.doi.org/10.3748/wjg.v12.i48.7878


