Copyright
©2006 Baishideng Publishing Group Co.
World J Gastroenterol. Nov 14, 2006; 12(42): 6893-6897
Published online Nov 14, 2006. doi: 10.3748/wjg.v12.i42.6893
Published online Nov 14, 2006. doi: 10.3748/wjg.v12.i42.6893
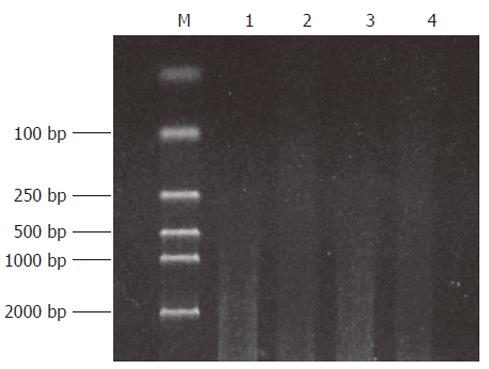
Figure 1 The effect of RsaIdigestion.
Lane 1, 3: cDNA of Hca-F and Hca-P cells; Lane 2, 4: cDNA of Hca-F and Hca-P cells after RsaIdigestion; M: DNA marker DL2000.
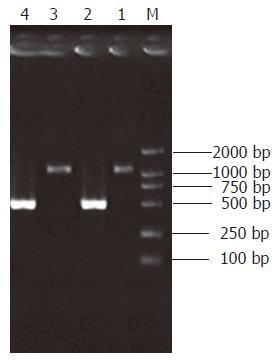
Figure 2 Ligation efficiency analysis.
Lane 1: Tester-1 as template, G3PDH 3’Primer and PCR Primer1; Lane 2: Tester-1 as template, G3PDH 3‘Primer and G3PDH 5‘Primer; Lane 3: Tester-2R as template, G3PDH 3‘Primer and PCR Primer1; Lane 4: Tester-2R as template, G3PDH 3‘Primer and G3PDH 5‘Primer.
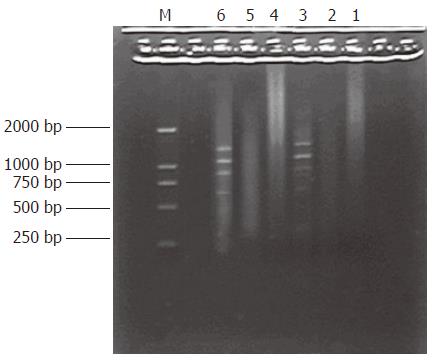
Figure 3 The results of secondary PCR amplification.
Lane 1-3: Product of primary PCR amplification, Lane 4: secondary PCR amplification product of unsubtracted cDNA, Lane 5: secondary PCR amplification product of subtracted cDNA, Lane 6: secondary PCR amplification product of PCR control cDNA, M: DNA Marker DL2000.
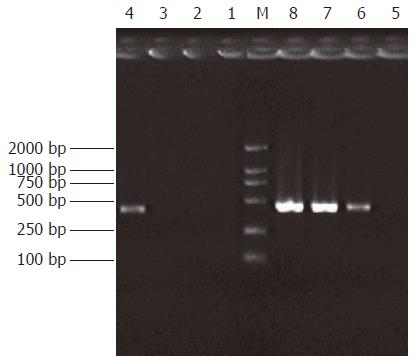
Figure 4 Analysis of subtraction effect.
PCR was performed on subtracted (Lane 1-4) or unsubtracted (Lane 5-8) secondary PCR product with G3PDH 5’Primer and 3’primer. Lanes 1, 5: 20 cycles, Lanes 2, 6: 25 cycles, Lanes 3, 7: 30 cycles, Lanes 4, 8: 35 cycles. M: DNA marker DL2000.
Figure 5 The results of clone PCR amplification.
There was an average insert size of 300-1000 bp. M: DNA marker DL2000.
- Citation: Cui XN, Tang JW, Hou L, Song B, Ban LY. Identification of differentially expressed genes in mouse hepatocarcinoma ascites cell line with low potential of lymphogenous metastasis. World J Gastroenterol 2006; 12(42): 6893-6897
- URL: https://www.wjgnet.com/1007-9327/full/v12/i42/6893.htm
- DOI: https://dx.doi.org/10.3748/wjg.v12.i42.6893


