©2006 Baishideng Publishing Group Co.
World J Gastroenterol. Oct 21, 2006; 12(39): 6376-6381
Published online Oct 21, 2006. doi: 10.3748/wjg.v12.i39.6376
Published online Oct 21, 2006. doi: 10.3748/wjg.v12.i39.6376
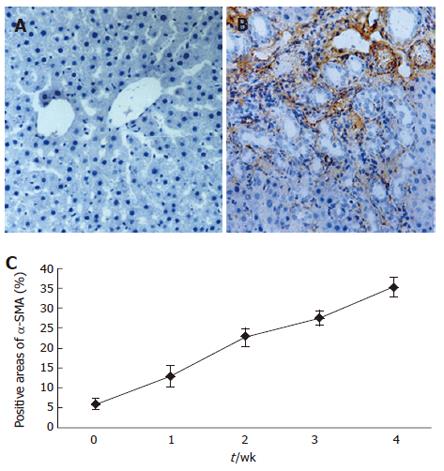
Figure 1 α-SMA protein expression in immunohistochemically-stained liver tissue (SP × 200).
A: Few α-SMA expressions in sham operation group; B: Positive α-SMA cells residing in the cells of portal ducts, fiber septa, perisinuses and around the proliferated bile ducts 2 wk after BDL; C: Positive areas of α-SMA expression in model groups at wk 1 to 4 after common bile duct ligation.
Figure 2 ERK1 distribution in immunohistochemically-stained liver tissue (SP × 200).
A: ERK1 distribution in sham operation group; B: ERK1 distribution 2 wk after BDL; C: The time course of ERK1 distribution in hepatic fibrogenesis.
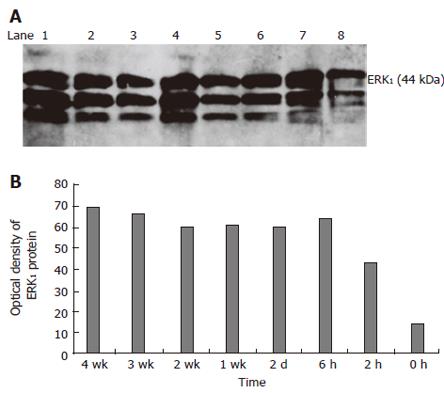
Figure 3 Time course of ERK1 protein expression (A) and quantitative results (B) in fibrotic and normal rat liver tissues by Western blotting analysis.
1: 4 wk after BDL; 2: 3 wk after BDL; 3: 2 wk after BDL; 4: 1 wk after BDL; 5: 2 d after BDL; 6: 6 h after BDL; 7: 2 h after BDL; 8: Sham operation group.
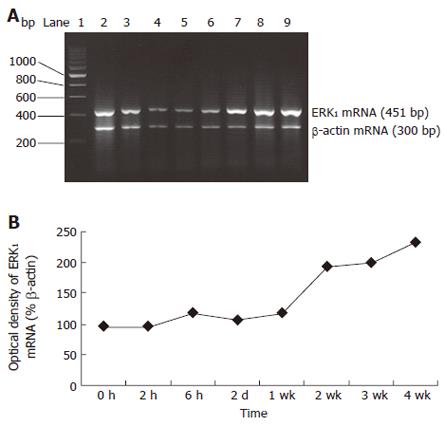
Figure 4 Electrophoresis of RT-PCR for ERK1 mRNA expression in hepatic fibrogenesis at different time points (A) and percentage of optical density of ERK1 mRNA electrophoretic strip (B).
1: marker; 2: sham operation group; 3: 2 h after BDL; 4: 6 h after BDL; 5: 2 d after BDL; 6: 1 wk after BDL; 7: 2 wk after BDL; 8: 3 wk after BDL; 9: 4 wk after BDL.
- Citation: Zhang XL, Liu JM, Yang CC, Zheng YL, Liu L, Wang ZK, Jiang HQ. Dynamic expression of extracellular signal-regulated kinase in rat liver tissue during hepatic fibrogenesis. World J Gastroenterol 2006; 12(39): 6376-6381
- URL: https://www.wjgnet.com/1007-9327/full/v12/i39/6376.htm
- DOI: https://dx.doi.org/10.3748/wjg.v12.i39.6376


