Copyright
©2006 Baishideng Publishing Group Co.
World J Gastroenterol. Oct 7, 2006; 12(37): 5987-5994
Published online Oct 7, 2006. doi: 10.3748/wjg.v12.i37.5987
Published online Oct 7, 2006. doi: 10.3748/wjg.v12.i37.5987
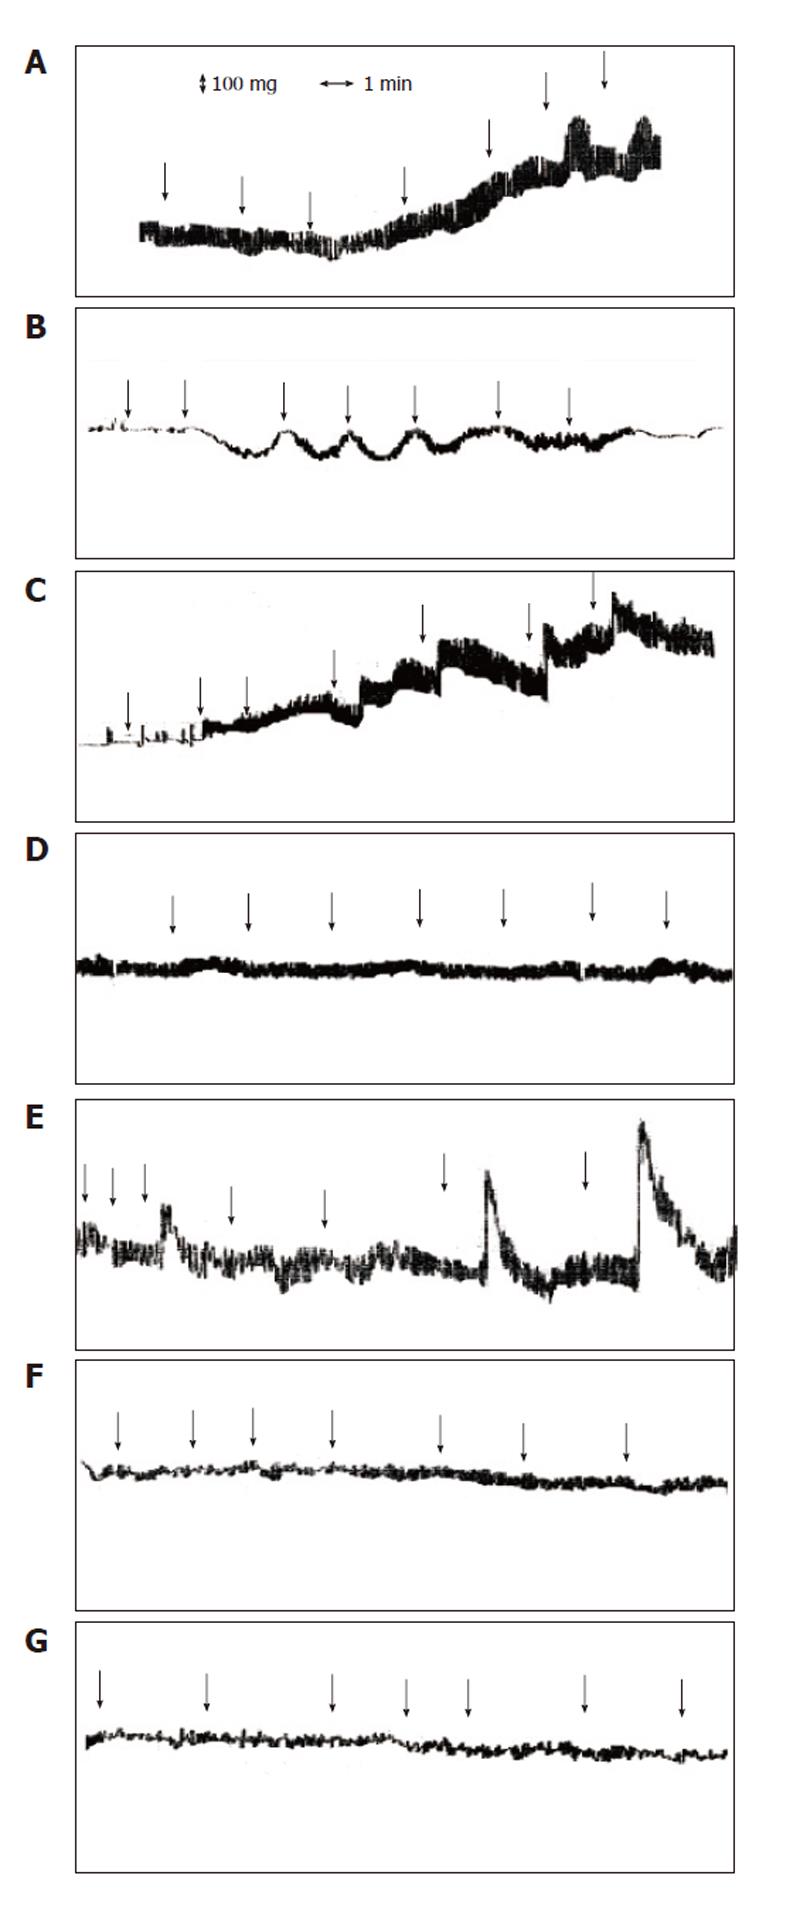
Figure 1 Recorder tracing of the cumulative dose of VSL#3 (A), Bifidobacterium (B), Lactobacillus (C), Streptococcus thermophilus (D), Salmonella aboni (E), Escherichia coli (F), and Bacillus licheniformis (G) crude extracts on the contractility of Guinea-pig isolated ileum.
Arrows indicate the addition of 50, 100, 150, 200, 250, 300 and 350 μL of each crude extract tested.
Figure 2 Recorder tracing of the cumulative dose of VSL#3 (A), Bifidobacterium (B), Lactobacillus (C), Streptococcus thermophilus (D), Salmonella aboni (E), Escherichia coli (F), and Bacillus licheniformis (G) crude extracts on the contractility of Guinea-pig isolated proximal colon.
Arrows indicate the addition of 50, 100, 150, 200, 250, 300 and 350 μL of each crude extract tested.
Figure 3 Relaxation induced by crude extract of VSL#3 mixture, Lactobacillus, Streptococcus, Bifidobacterium, Escherichia coli, Salmonella aboni and Bacillus licheniformis preparations on Guinea-pig proximal colon.
Relaxation was expressed as change in mg-tension per cm of chart paper in resting tone (A). Relaxation was expressed in percentage, by considering VSL#3 mixture-induced maximal relaxation as 100% (B). The volume (μL) indicates the minimal value exerting maximal relaxation effects. Each crude extract was prepared from a bacterial suspension equivalent to a concentration of 3.5 x 10⁹ CFUs/mL. Each point is the mean ± SE of 5 to 7 observations. Mean ± SE was given (P < 0.05).
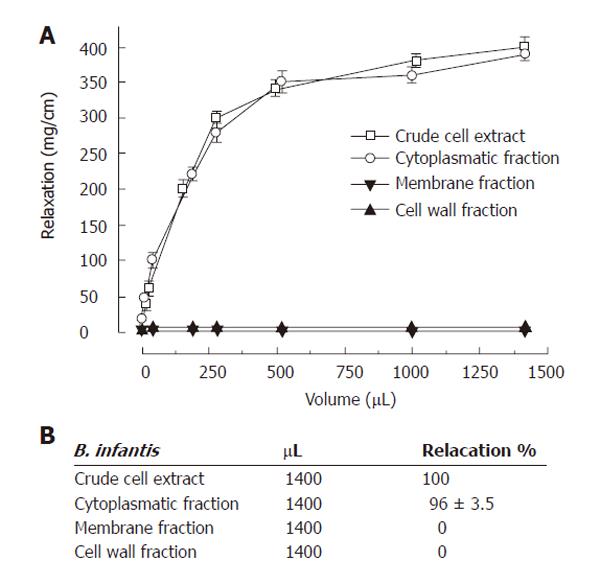
Figure 4 Relaxation induced by B.
infantis crude extract, cytoplasmatic fraction, membrane fraction and cell wall fraction on Guinea-pig proximal colon. Relaxation was expressed as change in mg-tension per cm of chart paper in resting tone (A). Relaxation was expressed in percentage, by considering crude extract-induced maximal relaxation as 100% (B). The volume (μL) indicates the minimal value exerting maximal relaxation effects. Each crude extract was prepared from a bacterial suspension equivalent to a concentration of 3.5 x 10⁹ CFUs/mL. Each point is the mean ± SE of 5 to 7 observations. Mean ± SE was given (P < 0.05).
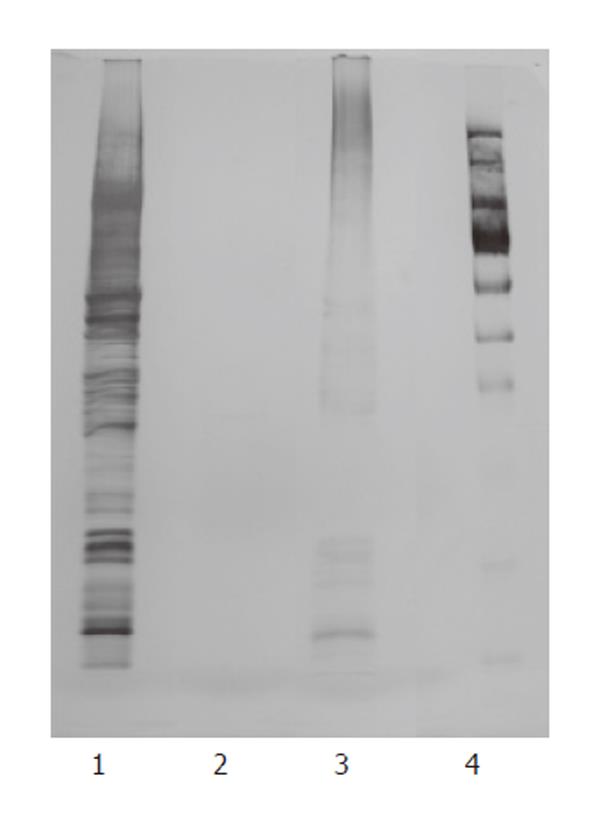
Figure 5 SDS PAGE elec-trophoresis of B.
infantis cytoplasmatic fraction (lane 1), cytoplasmatic non-proteinaceous components (lane 2), cytoplas-matic fraction proteinase K digested (lane 3), molecular weight marker (lane 4).
Figure 6 Relaxation induced by B.
infantis cytoplasmatic fraction, cytoplasmatic proteinaceous components, cytoplasmatic non-proteinaceous components and cytoplasmatic fraction proteinase K digested on guinea-pig proximal colon Relaxation was expressed as change in mg-tension per cm of chart paper in resting tone (A). Relaxation was expressed in percentage, by considering cytoplasmatic fraction-induced maximal relaxation as 100% (B). The volume (μL) indicates the minimal value exerting maximal relaxation effects. Each crude extract was prepared from a bacterial suspension equivalent to a concentration of 3.5 x 10⁹ CFUs/mL. Each point is the mean ± SE of 5 to 7 observations.
- Citation: Massi M, Ioan P, Budriesi R, Chiarini A, Vitali B, Lammers KM, Gionchetti P, Campieri M, Lembo A, Brigidi P. Effects of probiotic bacteria on gastrointestinal motility in guinea-pig isolated tissue. World J Gastroenterol 2006; 12(37): 5987-5994
- URL: https://www.wjgnet.com/1007-9327/full/v12/i37/5987.htm
- DOI: https://dx.doi.org/10.3748/wjg.v12.i37.5987


