Copyright
©2006 Baishideng Publishing Group Co.
World J Gastroenterol. Sep 21, 2006; 12(35): 5721-5725
Published online Sep 21, 2006. doi: 10.3748/wjg.v12.i35.5721
Published online Sep 21, 2006. doi: 10.3748/wjg.v12.i35.5721
Figure 1 Effects of BNE on secreted HBsAg, HBeAg and HBV DNA from HepG2 2.
2.15 cell cultures. A: HBsAg level; B: HBeAg level; C: Viral DNA. The dotted line presents the limitation of this kit (3000 copies/mL). Data are expressed as mean ± SE of three independent experiments. aP < 0.05; bP < 0.01 vs the corresponding controls (Student’s t-test).
Figure 2 Cytotoxic effects of BNE on HepG2 2.
2.15 cells. Data are expressed as mean ± SE of three independent experiments (MTT assay).
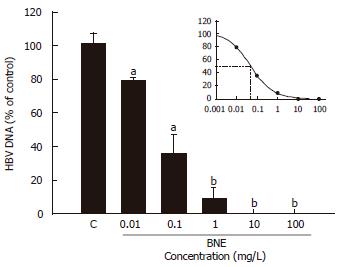
Figure 3 Determination of the effective concentration of BNE anti-HBV activity.
Cells were treated for 24 h. Data are expressed as mean ± SE of three independent experiments. aP < 0.05, bP < 0.01 vs the corresponding controls (Student’s t-test).
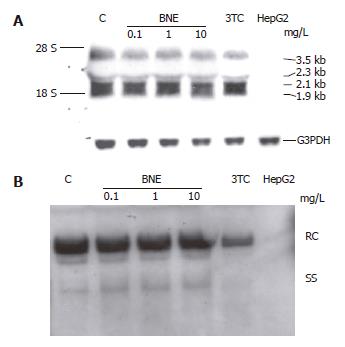
Figure 4 Effects of BNE on intracellular HBV DNA replication and transcription in HepG2 2.
2.15 cells. Cells were treated for 1 d. A: Northern analysis; B: Southern analysis.
-
Citation: Huang KL, Lai YK, Lin CC, Chang JM. Inhibition of hepatitis B virus production by
Boehmeria nivea root extract in HepG2 2.2.15 cells. World J Gastroenterol 2006; 12(35): 5721-5725 - URL: https://www.wjgnet.com/1007-9327/full/v12/i35/5721.htm
- DOI: https://dx.doi.org/10.3748/wjg.v12.i35.5721


