Copyright
©2006 Baishideng Publishing Group Co.
World J Gastroenterol. Aug 21, 2006; 12(31): 4996-5004
Published online Aug 21, 2006. doi: 10.3748/wjg.v12.i31.4996
Published online Aug 21, 2006. doi: 10.3748/wjg.v12.i31.4996
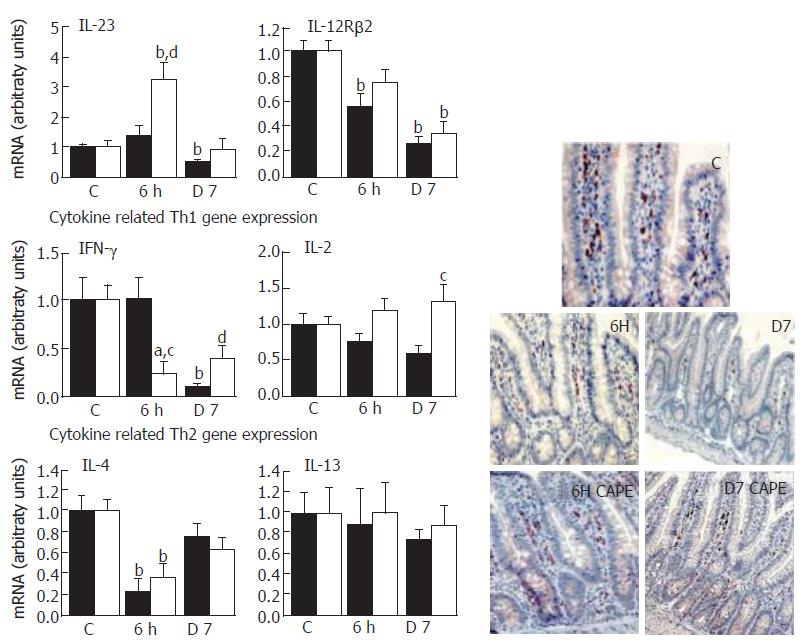
Figure 1 Th1/Th2-like pattern of gene expression in the ileal mucosal layer after γ-irradiation in rats.
(■): CAPE-untreated, (□): CAPE-treated and CD4+ immunostaining in control (C), 6 h and 7 d (D7) after irradiation (D (x 20) (mean ± SEM, n = 6); aP < 0.05, bP < 0.01 vs control; cP < 0.05, dP < 0.001 vs untreated.
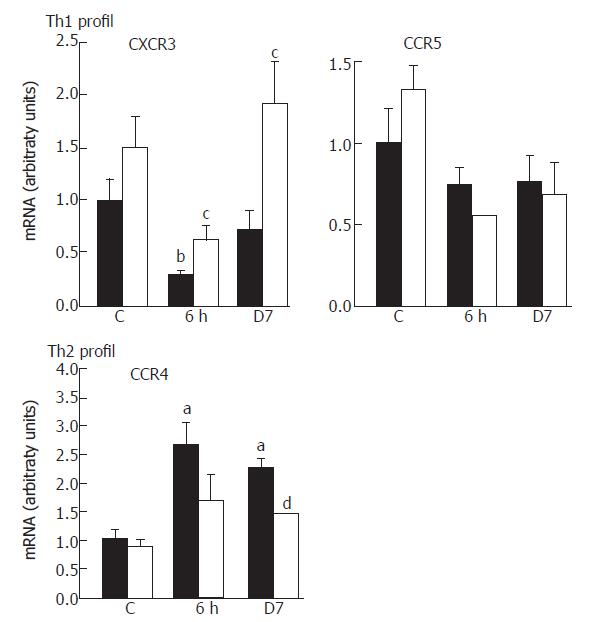
Figure 2 Expression of the chemokine receptors CXCR3/CCR5 and CCR4 post-irradiation in rats.
(■): CAPE-untreated; (□): CAPE-treated (mean ± SEM, n = 6); aP < 0.05, bP < 0.01 vs control; cP < 0.05, dP < 0.01 vs untreated rats.
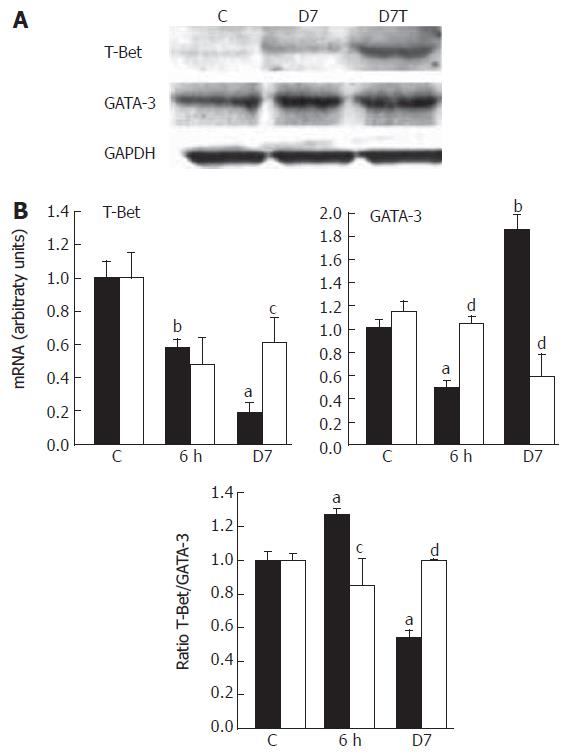
Figure 3 Expression of transcription factors of Th1/Th2 polarization after irradiation in rats.
(■): CAPE-untreated; (□): CAPE-treated. A: Western blot analysis using T-Bet and GATA-3 polyclonal antibody, GAPDH levels are used as internal standard; B: Real-time RT-PCR analysis (mean ± SEM, n = 6); aP < 0.005, bP < 0.01 vs control; cP < 0.05, dP < 0.01 vs untreated rats.
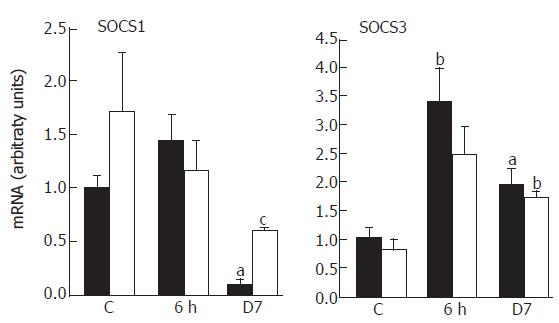
Figure 4 Expression of the regulator cytokine gene SOCS1 and SOCS3 after irradiation in rats.
(■): CAPE-untreated; (□): CAPE-treated (mean ± SEM, n = 6); aP < 0.05, bP < 0.01 vs control; cP < 0.05, dP < 0.01 vs untreated.
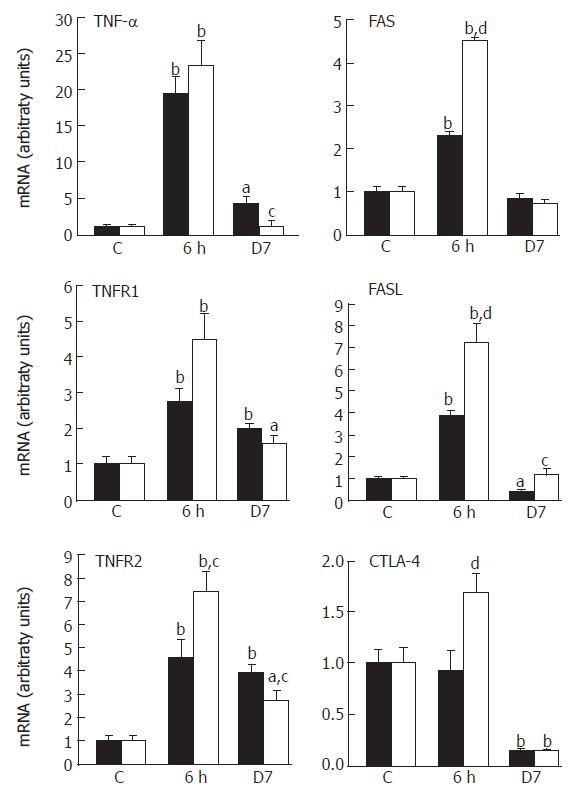
Figure 5 Irradiation effect on extrinsic apoptotic factors TNF-α, FasL and related-receptors expression post-irradiation in rats.
(■): CAPE-untreated; (□): CAPE-treated (mean ± SEM, n = 6); aP < 0.05, bP < 0.01 vs control; cP < 0.05, dP < 0.01 vs untreated rats.
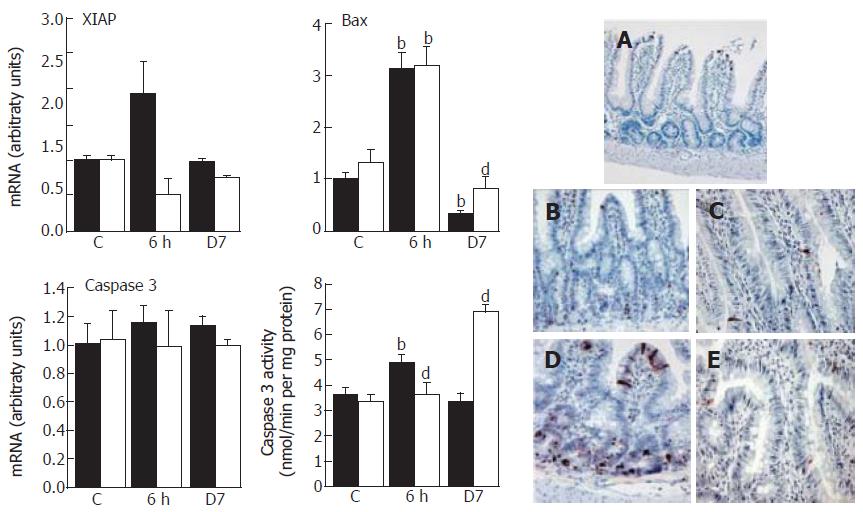
Figure 6 Irradiation effect on intrinsic apoptotic factor expression modulation and caspase activity post-irradiation in rats.
(■): CAPE-untreated (□): CAPE-treated. Apoptotic cells presence was confirmed by the terminal deoxynucleotidyltransferase (TdT)-mediated dUTP-biotin nick-end labeling (TUNEL) staining in ileum. (A): Control; (B): 6 h; (C): 7 d after γ-irradiation. (D): 6 h; (E): 7 d from irradiated CAPE-treated (x 20) (mean ± SEM, n = 6); bP < 0.01 vs control; dP < 0.01 vs untreated.
- Citation: Grémy O, Benderitter M, Linard C. Caffeic acid phenethyl ester modifies the Th1/Th2 balance in ileal mucosa after γ-irradiation in the rat by modulating the cytokine pattern. World J Gastroenterol 2006; 12(31): 4996-5004
- URL: https://www.wjgnet.com/1007-9327/full/v12/i31/4996.htm
- DOI: https://dx.doi.org/10.3748/wjg.v12.i31.4996


