Copyright
©2006 Baishideng Publishing Group Co.
World J Gastroenterol. Aug 7, 2006; 12(29): 4710-4715
Published online Aug 7, 2006. doi: 10.3748/wjg.v12.i29.4710
Published online Aug 7, 2006. doi: 10.3748/wjg.v12.i29.4710
Figure 1 A: Time course of the effect on short-circuit current (Isc) of GH (4 × 10⁻⁹ mol/L) and L-NAME (2 × 10⁻⁴ mol/L), alone or in combination, to Caco-2 cells mounted in Ussing chambers; B: Isc peak after L-NAME or GH addition, alone or in combination, to Caco-2 cells mounted in Ussing chambers.
Data are mean ± SD of 6 different observations. aP < 0.05 GH vs L-NAME + GH.
Figure 2 A: Time course of the GH (4 × 10⁻⁹ mol/L) effect on CT (6 × 10⁻⁸ mol/L)-induced short-circuit a current (Isc) increase in the absence or in the presence of L-NAME (2 × 10⁻⁴ mol/L) in Caco-2 cells mounted in Ussing chambers.
The arrows indicate the time of addition of each agent; B: Maximal Isc increase after CT addition, alone or in the presence of GH alone or in combination with L-NAME. A total abrogation of the antagonistic effect of GH on the CT-induced electrical response was observed in the presence of L-NAME. Data are mean ± SD of 6 different observations. aP < 0.05 CT alone vs GH + CT; cP < 0.05 GH + CT vs L-NAME + GH + CT.
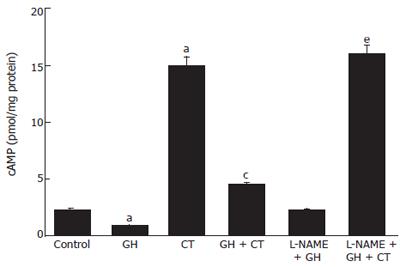
Figure 3 Modification of intracellular cAMP concentration in Caco-2 cells after incubation with GH, CT, alone or in combination, in the presence or in the absence of L-NAME.
Data are mean ± SD of 6 different observations. aP < 0.05 vs control; cP < 0.05 CT alone vs GH + CT; eP < 0.05 GH + CT vs L-NAME + GH + CT.
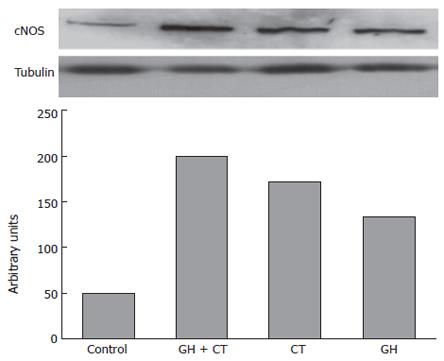
Figure 4 The upper side of the figure shows the cNOS protein expression in Caco-2 cells after 1 h of incubation with GH and CT alone or in combination, as compared to tubulin expression.
The cNOS protein expression is revealed by the appearance of 160-kD band that corresponds to human NOS 1 (neuronal NOS). Shown is a representation of 3 separate experiments. In the lower side of the figure an optical densitometry analysis of the bands is also reported.
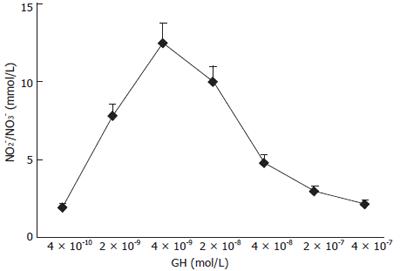
Figure 5 Effects of increasing concentration of GH on NO production in Caco-2 cells.
Increasing concentrations of GH were added to Caco-2 cell monolayers and NO production was determined after 1 h of incubation. Data are mean ± SD of 6 different observations.
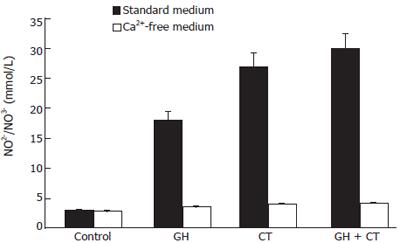
Figure 6 Total NO production in Caco-2 cells under basal conditions and after stimulation with GH and CT, alone or in combination, in standard or in Ca2+-free medium.
Data are mean ± SD of 6 different observations. aP < 0.05 vs control.
- Citation: Canani RB, Cirillo P, Mallardo G, Buccigrossi V, Passariello A, Ruotolo S, Marco GD, Porcaro F, Guarino A. Growth hormone regulates intestinal ion transport through a modulation of the constitutive nitric oxide synthase-nitric oxide-cAMP pathway. World J Gastroenterol 2006; 12(29): 4710-4715
- URL: https://www.wjgnet.com/1007-9327/full/v12/i29/4710.htm
- DOI: https://dx.doi.org/10.3748/wjg.v12.i29.4710


