Copyright
©2006 Baishideng Publishing Group Co.
World J Gastroenterol. Aug 7, 2006; 12(29): 4683-4688
Published online Aug 7, 2006. doi: 10.3748/wjg.v12.i29.4683
Published online Aug 7, 2006. doi: 10.3748/wjg.v12.i29.4683
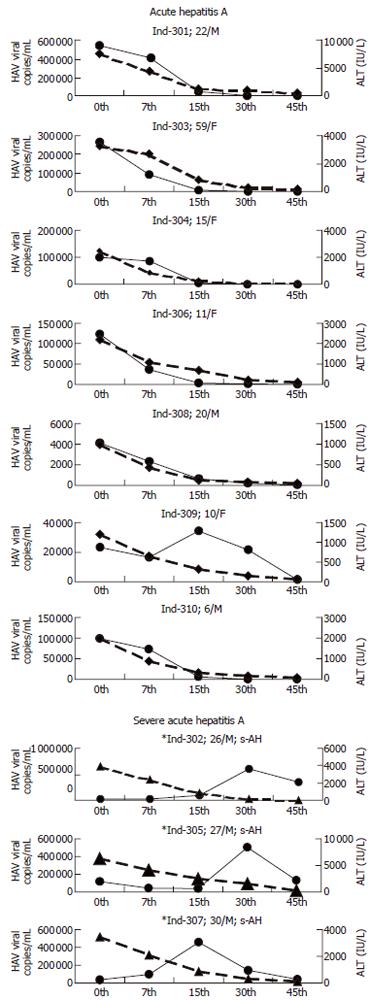
Figure 1 Relationship of hepatitis A virus (HAV) viral load (●) to levels of alanine aminotransferase (ALT) (▲) in serum at different day of follow up.
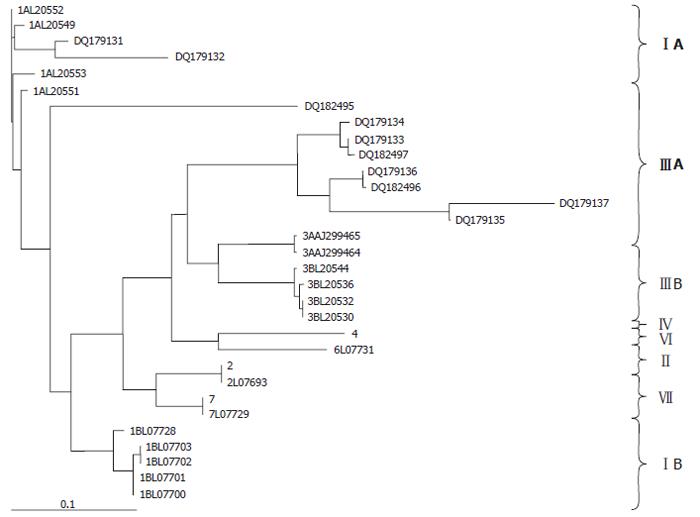
Figure 2 A neighbor-joining phylogenetic tree for isolates of hepatitis A virus based on the sequencing of the VP1-P2A region.
Isolates DQ179131 (Ind-301), DQ179132 (Ind-302), DQ179133 (Ind-303), DQ179134 (Ind-304), DQ179135 (Ind-305), DQ179136 (Ind-306), DQ179137 (Ind-307), DQ182495 (Ind-308), DQ182496 (Ind-309), DQ182497 (Ind-310) were collected during the present study, in PCR Hepatitis Laboratory, MAM College and associated LNJ Hospital, New Delhi, India.
- Citation: Hussain Z, Das BC, Husain SA, Polipalli SK, Ahmed T, Begum N, Medhi S, Verghese A, Raish M, Theamboonlers A, Poovorawan Y, Kar P. Virological course of hepatitis A virus as determined by real time RT-PCR: Correlation with biochemical, immunological and genotypic profiles. World J Gastroenterol 2006; 12(29): 4683-4688
- URL: https://www.wjgnet.com/1007-9327/full/v12/i29/4683.htm
- DOI: https://dx.doi.org/10.3748/wjg.v12.i29.4683


