Copyright
©2006 Baishideng Publishing Group Co.
World J Gastroenterol. Jul 28, 2006; 12(28): 4485-4491
Published online Jul 28, 2006. doi: 10.3748/wjg.v12.i28.4485
Published online Jul 28, 2006. doi: 10.3748/wjg.v12.i28.4485
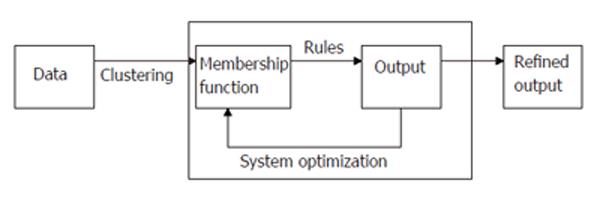
Figure 1 Overview of fuzzy methodology.
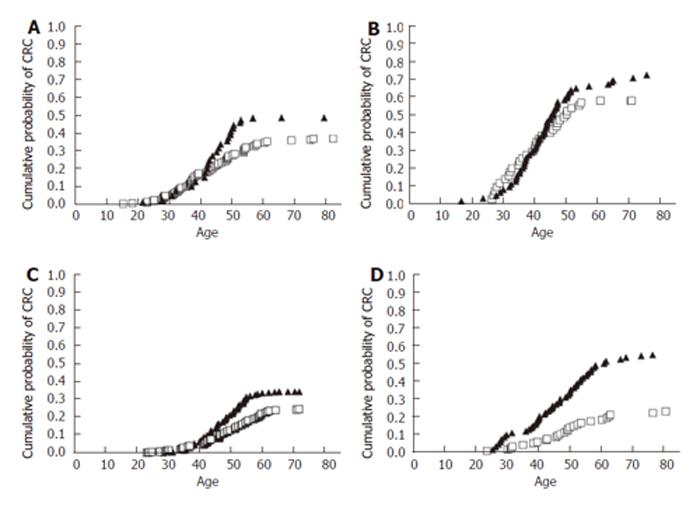
Figure 2 Scattergram demonstrating the probability of developing CRC (cumulative lifetime risk) for each subject based on smoking status, ▲= Smokers, □ = Non-Smokers.
Data are divided by gene mutation and sex with (A) hMLH1: Female, (B) hMLH1: Male, (C) hMSH2: Female and (D) hMSH2: Male (P < 0.05).
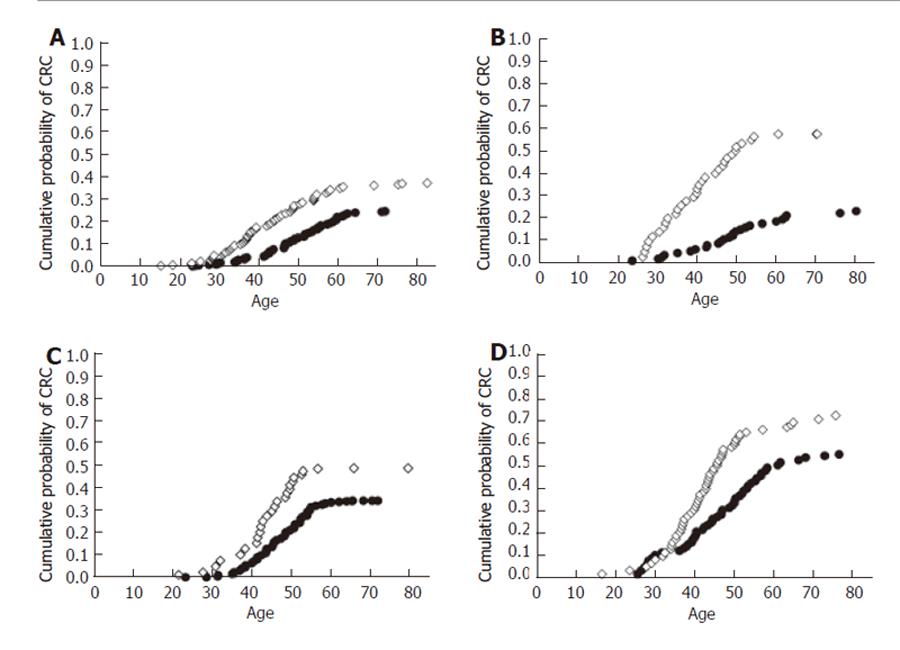
Figure 3 Scattergram demonstrating the probability of developing CRC (cumulative lifetime risk) for each subject based on genetic mutation, ◊ = hMLH1, ● = hMSH2.
Data are divided by sex and smoking status with (A) Female: non-smokers (P < 0.001), (B) Female: smokers (P < 0.001), (C) Male: non-smokers (P < 0.001) and (D) Male: smokers (P < 0.05). The P values show the probability failing to reject the null hypothesis that the data originate from identical populations, indicating that the curves are different.
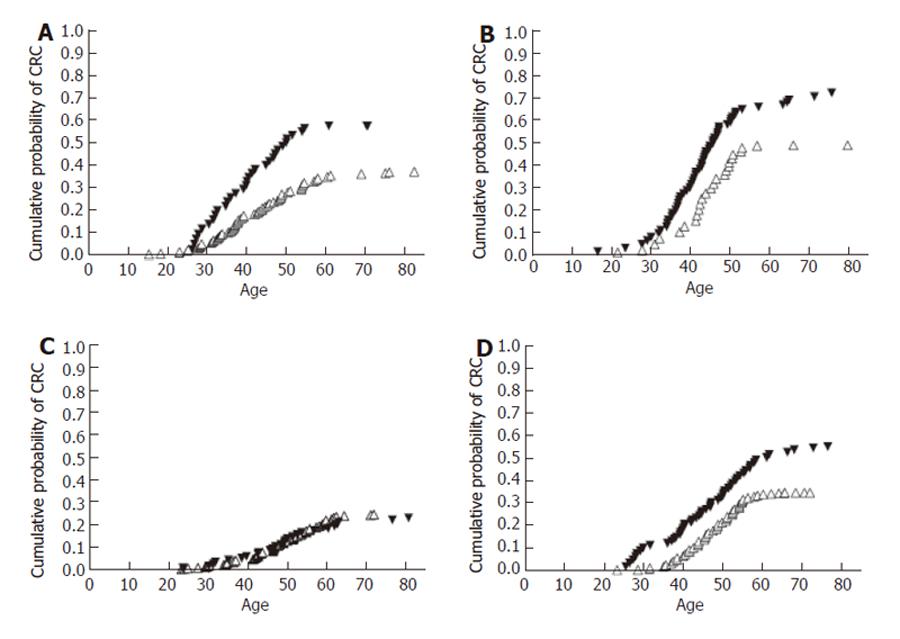
Figure 4 Scattergram demonstrating the probability of developing CRC (cumulative lifetime risk) for each subject based on gender, △ = female, ▼=male.
Data are divided by gene mutation and smoking status with (A) hMLH1: non-smokers, (B) hMLH1: smokers (P < 0.1), (C) hMSH2: non-smokers (P > 0.05) and (D) hMSH2: smokers (P < 0.1). The P values show the probability of failing to reject the null hypothesis that the data originate from identical populations, indicating that the curves are different.
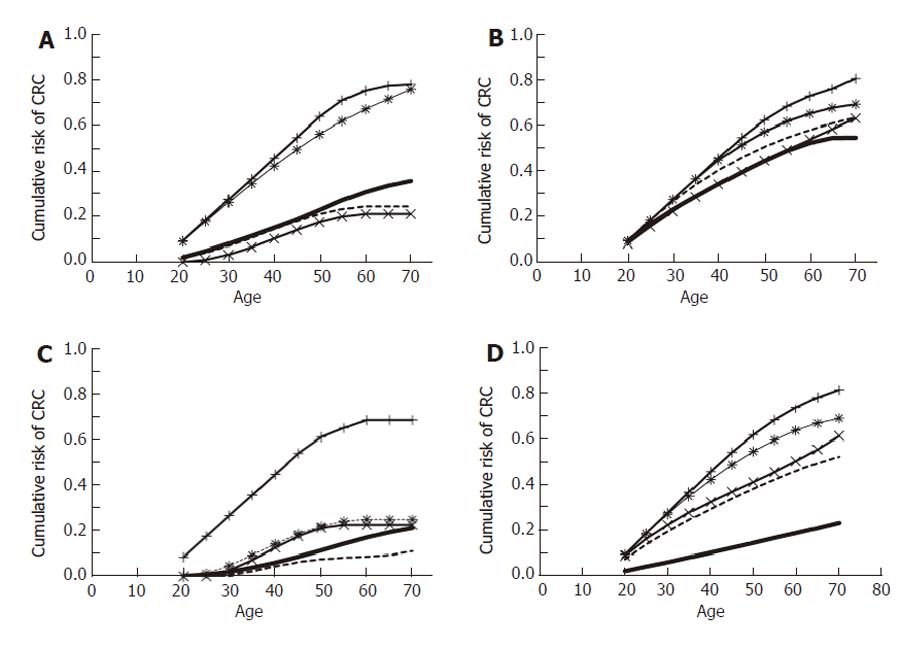
Figure 5 Probability of developing CRC (cumulative lifetime risk) based on a model containing pack years for (A) females with hMLH1 mutation (P < 0.
01), (B) males with hMLH1 mutation (P < 0.05), (C) females with hMLH1 mutation (P < 0.01), and (D) males with hMSH2 mutation (P < 0.01). The P values show the probability of failing to reject the null hypothesis that the data originate from identical populations. The number of pack years is as follows: - = 0, -x- = 10, --- = 20, -*- = 30 and -+- = 40.
- Citation: Brand RM, Jones DD, Lynch HT, Brand RE, Watson P, Ashwathnayaran R, Roy HK. Risk of colon cancer in hereditary non-polyposis colorectal cancer patients as predicted by fuzzy modeling: Influence of smoking. World J Gastroenterol 2006; 12(28): 4485-4491
- URL: https://www.wjgnet.com/1007-9327/full/v12/i28/4485.htm
- DOI: https://dx.doi.org/10.3748/wjg.v12.i28.4485


