Copyright
©2006 Baishideng Publishing Group Co.
World J Gastroenterol. Jul 14, 2006; 12(26): 4214-4218
Published online Jul 14, 2006. doi: 10.3748/wjg.v12.i26.4214
Published online Jul 14, 2006. doi: 10.3748/wjg.v12.i26.4214
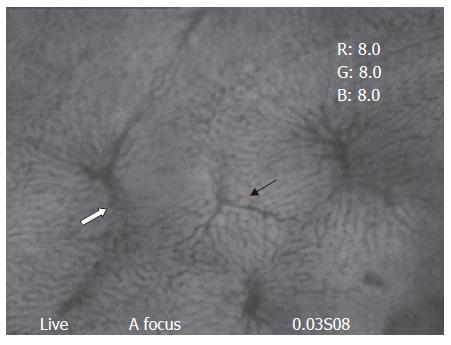
Figure 1 Normal microcirculation of the rat liver.
Arrow: TPV, Opened arrow: THV.
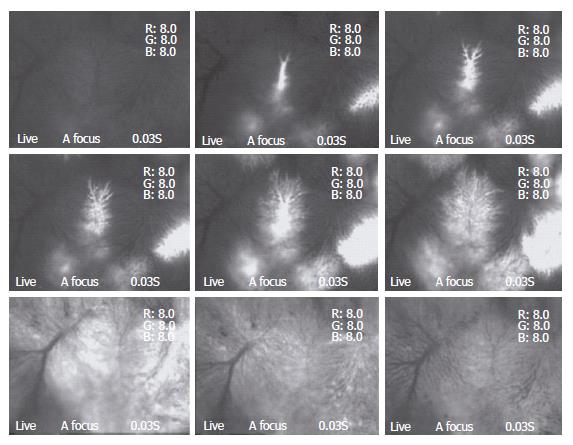
Figure 2 After infusion of fluorescent sodium from the GDA to proper hepatic artery, blood flow from TPVs to THVs through sinusoids can be clearly visualized.
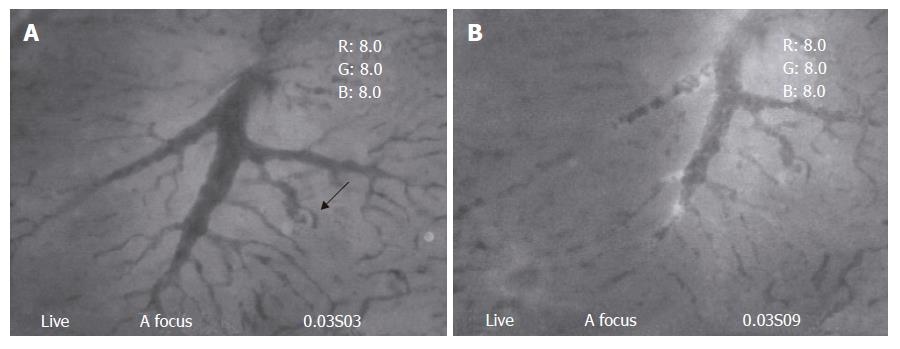
Figure 3 A: Small debris can enter sinusoids through TPV (arrow); B: The same TPV as image 3, debris of DSM continuously enter sinusoids through TPV, blood flow in TPV is intermittent but not stagnant.
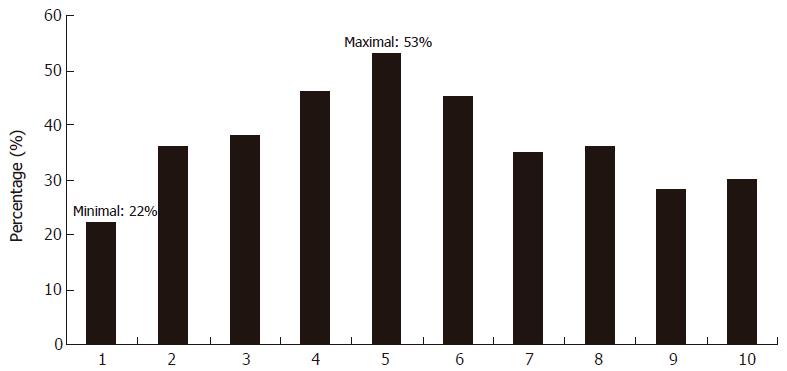
Figure 4 Percentage of the completely stagnant THVs 6 h after DSM injection in 10 rats.
The minimal percentage is 22%, and the maximal is 53%.
-
Citation: Wang J, Murata S, Kumazaki T. Liver microcirculation after hepatic artery embolization with degradable starch microspheres
in vivo . World J Gastroenterol 2006; 12(26): 4214-4218 - URL: https://www.wjgnet.com/1007-9327/full/v12/i26/4214.htm
- DOI: https://dx.doi.org/10.3748/wjg.v12.i26.4214


