Copyright
©2006 Baishideng Publishing Group Co.
World J Gastroenterol. Jun 14, 2006; 12(22): 3461-3465
Published online Jun 14, 2006. doi: 10.3748/wjg.v12.i22.3461
Published online Jun 14, 2006. doi: 10.3748/wjg.v12.i22.3461
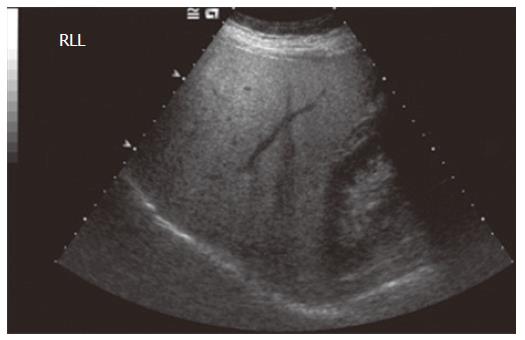
Figure 2 Ultrasound image of hepatic steatosis, showing increased echotexture of the liver parenchyma in comparison to the right kidney.
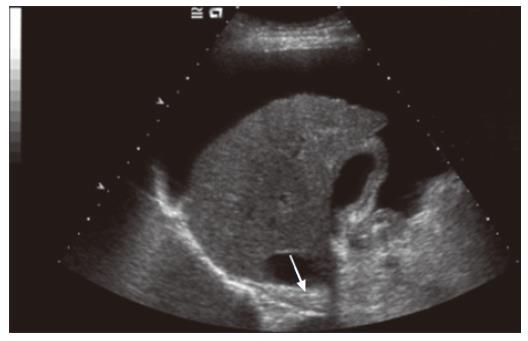
Figure 3 Ultrasound image of a typical cirrhotic liver with a shrunken right lobe, a nodular surface (white arrow), surrounding ascites and a heterogeneous echotexture.
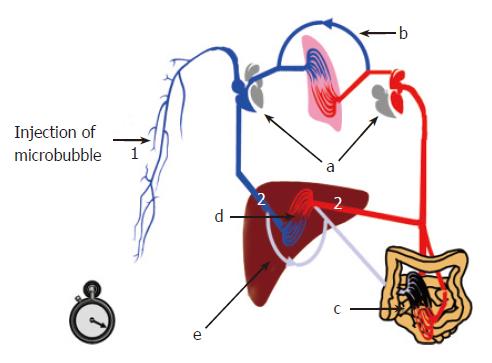
Figure 4 Characteristic haemodynamic changes seen in severe chronic liver disease which lead to the early arrival of microbubbles in the liver.
Time is measured from injection (1) to arrival in the liver (2).
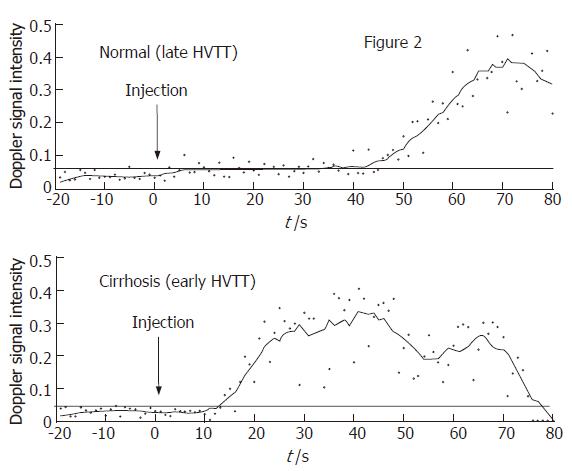
Figure 5 Hepatic vascular transit times (HVTT) following a bolus injection of a microbubble contrast agent, measured in a volunteer without significant liver disease (upper graph) and a patient with cirrhosis (lower graph).
There is a much shorter HVTT in the patient with cirrhosis. Adapted from Lim et al[23].
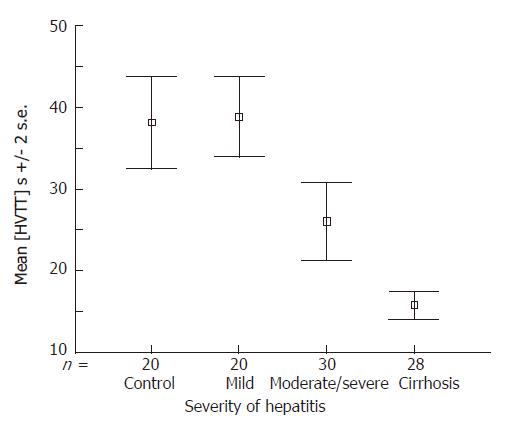
Figure 6 Graph showing hepatic vascular transit times (HVTT) in patients with mild hepatitis, moderate to severe hepatitis and established cirrhosis.
There is progressive shortening of the HVTT with increasing severity of liver disease. Adapted from Lim et al[23].
- Citation: Grier S, Lim AK, Patel N, Cobbold JF, Thomas HC, Cox IJ, Taylor-Robinson SD. Role of microbubble ultrasound contrast agents in the non-invasive assessment of chronic hepatitis C-related liver disease. World J Gastroenterol 2006; 12(22): 3461-3465
- URL: https://www.wjgnet.com/1007-9327/full/v12/i22/3461.htm
- DOI: https://dx.doi.org/10.3748/wjg.v12.i22.3461


